Amplitude S-1 & IPO Teardown
We summarize Amplitude's S-1 across its product, key business metrics, competition, and valuation.

Financial Snapshot
- $129M LTM revenue (+53% YoY)
- $157M Annualized revenue run rate (+66% YoY)
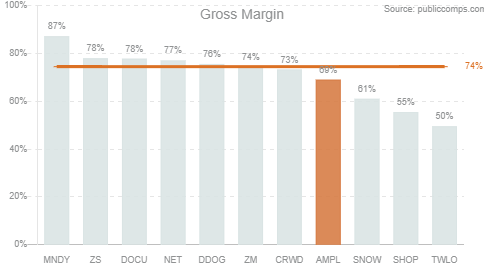
- 69% Gross margin
- (4%) FCF margin
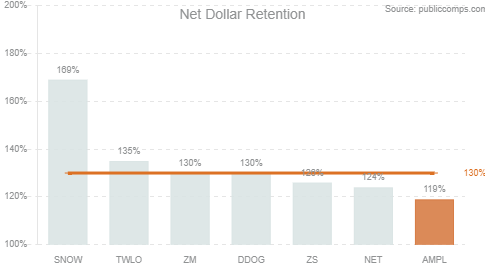
- 119% Dollar-based net retention rate
- 18 months CAC payback period
Summary
- Amplitude, a product analytics platform used by businesses to analyze user behavior data, released its S-1 this week and will go public via direct listing under the ticker AMPL.
- We believe it's reasonable that Amplitude will go public within at least a range of $5.0B - $6.4B which is 27-34x NTM revenue given its rapid growth, its valuation in the private markets of $4B in June 2021, and the valuations we're currently seeing for similar growth software businesses.
- Amplitude is among high-growth SaaS businesses at $157M ARRR (annualized revenue run rate) growing 66% YoY, with standard software gross margins (69%-73%). They estimate their market opportunity to be $37B in 2021, and expect expansion as COVID-19 further accelerates every company to be a digital tech company.
- The company offers three main products: Analytics, Experiment, and Recommend. Their bread and butter is Analytics, a robust platform for PMs to analyze customer behavior. Experiment is used to analyze how new product features perform, and Recommend allows businesses to personalize 1:1 user experiences. Pricing is a standard subscription model.
- Their GTM ostensibly puts a focus on enterprise customers, with 26% (out of 1,280) of their customers that spend >$100K accounting for 73% of total ARR. AMPL relies on channel partners to acquire customers internationally (36% of revenue), which we think will be a larger focus for Amplitude going forward.
- Amplitude will be the only analytics-dedicated software for products that is publicly traded, with its direct competitors operating privately and at a smaller scale. Their products also inherently compete with cloud data warehouses and business intelligence tools like Snowflake + Tableau since they're alternative ways to derive insights.
Overview
It was two years out of college for close friends Spenser Skates and Curtis Liu when they quit their jobs to build a voice recognition start-up (Sonalight). Mind you, it was 2012, and voice recognition was revolutionary! They attracted a ton of excitement, but eventually, found that users weren't sticking around... and really didn't have the tools to analyze why.
Naturally, they began focusing on their own solution (obviously the emotions were more complex, I'd argue even inspiring).
Officially launched in 2014, Amplitude Analytics was co-founded by Skates, Liu, and Jeffrey Wang. The team saw an opportunity when they realized there was no solution of the sort on the market: out-of-the-box tools for businesses to analyze user retention. Since then, the growth machine hasn't stopped, and the investors they've attracted since launch show:
- 2015: $9M Series A led by Benchmark Capital
- 2016: $15M Series B led by Battery Ventures
- 2017: $30M Series C led by IVP
- 2018: $80M Series D ($850M post-money valuation) led by Sequoia
- 2020: $50M Series E led by GIC
- 2021: $150M Series F ($4B pre-money valuation) led by Sequoia
Business Overview
Amplitude's mission statement: to help companies build better products — through data.
Simply put, they are a product analytics platform for businesses to 1) analyze customer behavior data stored on AMPL's platform and 2) improve products using that data + other tools.
Amplitude's magic is they're able to provide tools to derive these insights with zero code. Instead, Amplitude's data visualization tools have a very intuitive UI/UX and are catered to insights on customer behavior.
At the company's core is their Behavioral Graph, which is the name of the database they've built specifically to handle queries on customer behavior data. It's necessary because traditional relational databases were just not optimized for data analysis.
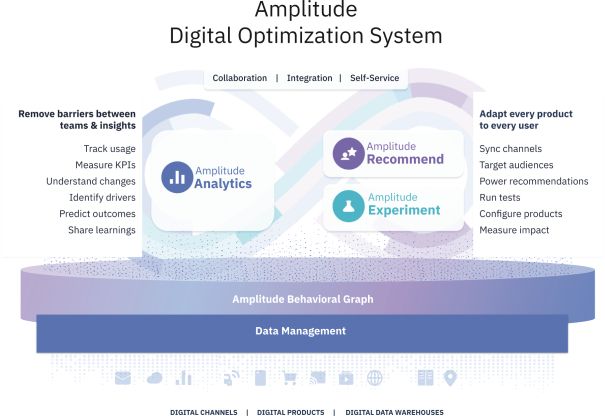
They have three main products: 1) Analytics; 2) Experiment; and 3) Recommend.
Per the S-1: "We currently derive, and expect to continue for some time to derive, substantially all of our revenue from our Amplitude Analytics product."
Amplitude Analytics
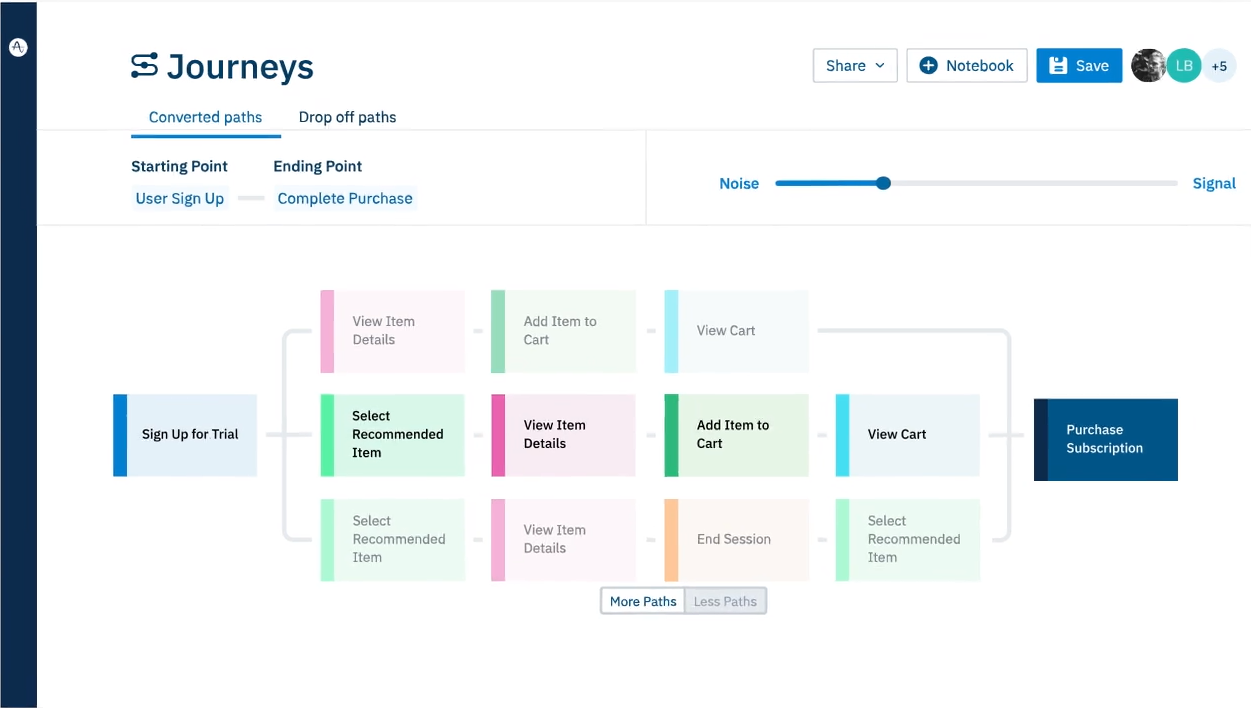
- The building block for Amplitude's platform. It provides teams with data about how customers engage with their product. Say you're selling a subscription service, and you have a couple of questions that you want answered:
- How many of my users signed up for a free trial?
- What percentage of users convert to become paid subscribers?
- Where are the customers that don't convert dropping off?
Amplitude's analytics platform looks to help answer these questions, looking to paint the full picture of how customers behave once they start using a product. Their goal is to help teams visualize the paths users take throughout their product experience.
It's also worth noting that Amplitude can do this in a fairly simple way: developers just need to drop a small snippet of Javascript code to wherever they want to track user actions.
Immediately, applications are able to begin collecting data, and developers are able to choose whichever user actions they want to track. For example, even your music player would easily be able to track whenever you pause or play your favorite song.
Amplitude Experiment
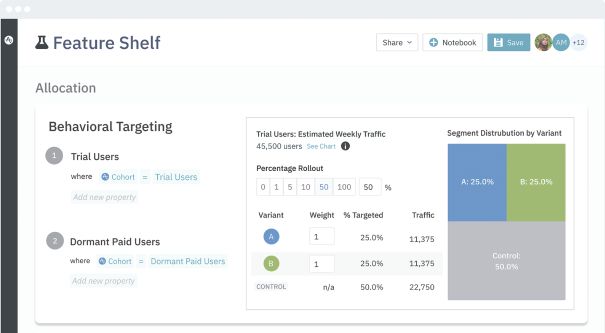
- Experiment is the next step to Amplitude's offerings, working in tandem with Analytics. It helps teams figure out how to improve their products via "experimenting", or testing, new product features for customers. Using data from Analytics, non-technical product managers are able to target specific customer segments and observe how they behave with a new feature. Below is a simple A/B test executed with Experiment, where "A" and "B" are two variations of a product shown to a customer segment.
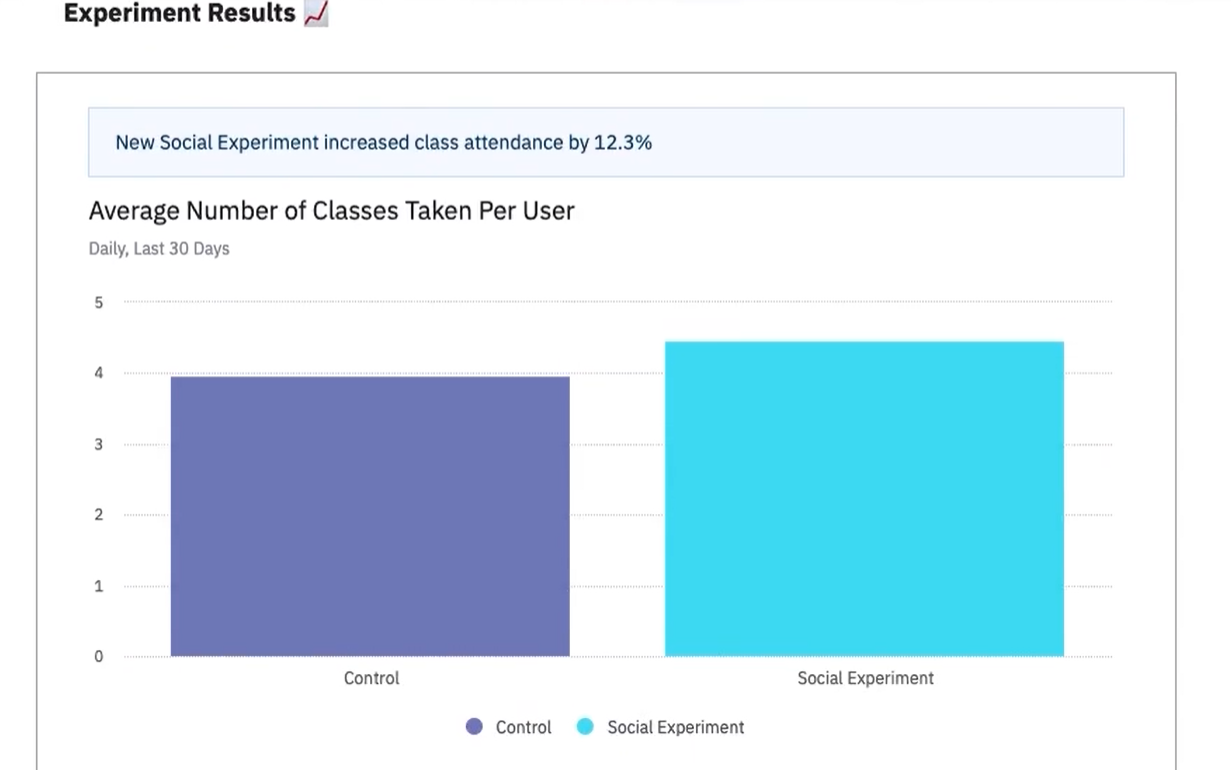
Along with A/B test execution, you can also analyze the results on customer behavior for each variation of a product feature. You find that customers who are shown the new interface end up buying 12.3% more classes over a set period of time, without needing help from your engineering team.
Amplitude Recommend
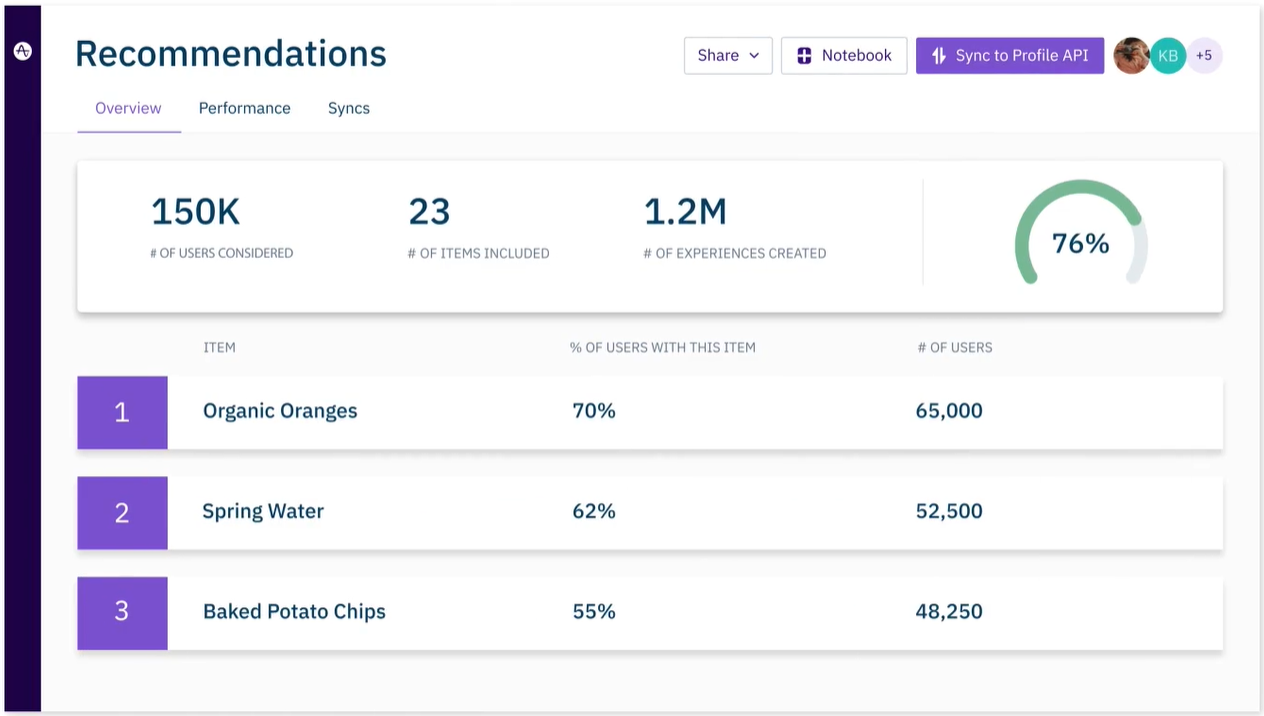
- Recommend helps teams increase engagement by personalizing experiences for individual customers in an automated way (without the need for code). Data from Amplitude Analytics is piped into an automated recommendation engine, which results in customers being shown items based on data about their previous actions.
Case Study: Intuit
You're a PM for Quickbooks, the leading accounting software used by over 5 million customers globally. It's your job to stay ahead of the competition because your boss wants you to help Quickbooks retain its position as a best-in-class product. But there's just one problem: every time you want data-driven insights about the product, you have to bother your data science team with the task of manually querying data with SQL.
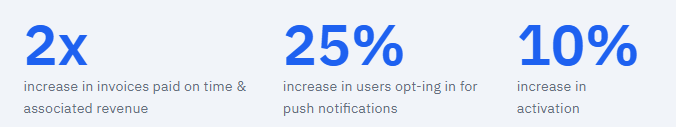
Then, you got access to Amplitude's Analytics product. All of a sudden, data insights are at the tip of your fingers - better yet, they're extremely digestible because of the visual format you get them in. 90% of your data requests that you once needed to ask someone to do can now be fulfilled through Amplitude, along with a few other pluses that makes your team happy:
Your data science team is pleased too...
"Life before Amplitude was difficult for the analyst teams and for the stakeholders, such as our product managers and marketers. Every time they wanted to know something, we would have to manually pull the data for them, and this could add days or weeks to the timeline." — John Humphrey, Head of Data Science & Analytics at Quickbooks
Feel free to see the full case study on their site here.
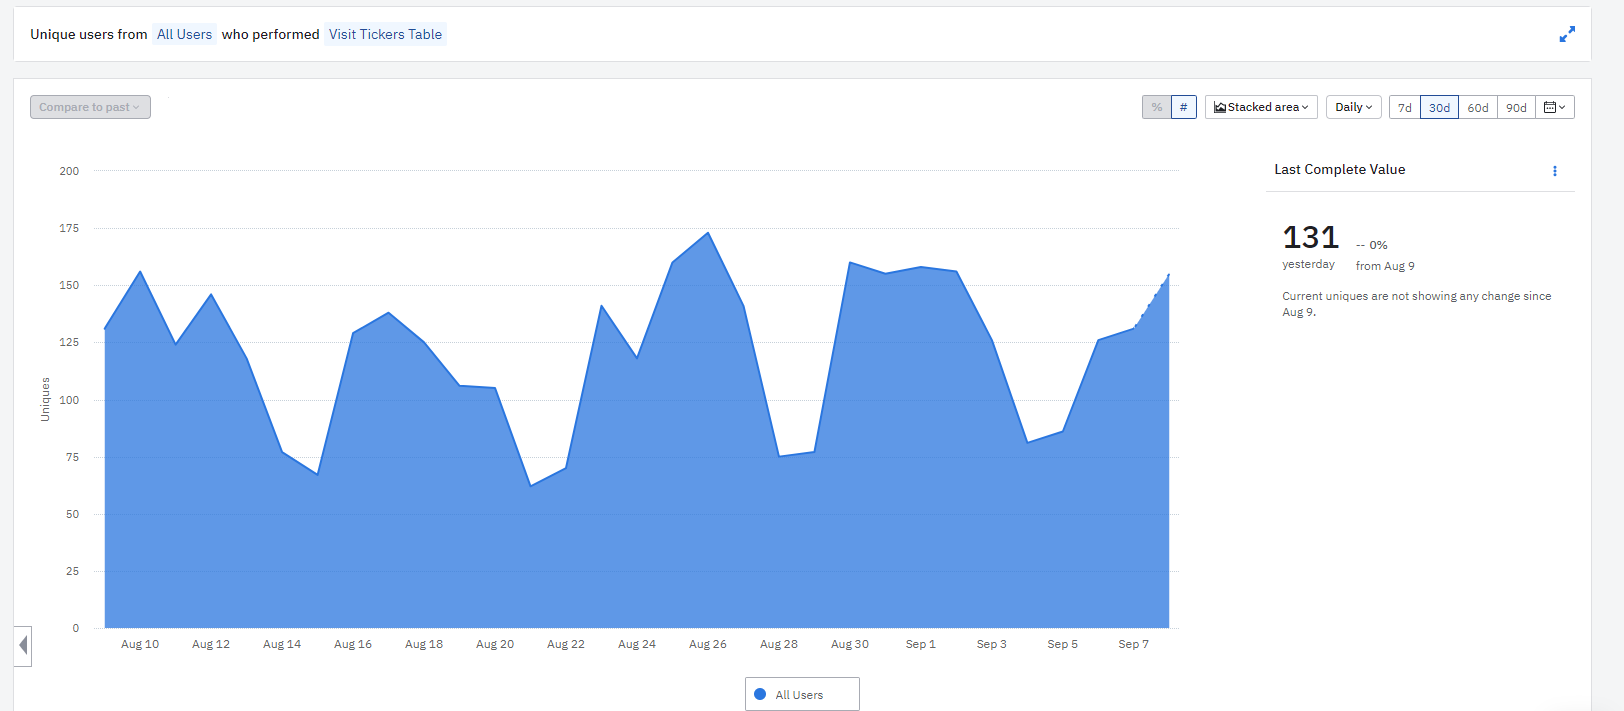
In fact, Public Comps is a customer of Amplitude. Here's an example of what one functionality of our Amplitude Analytics account can do from our perspective:
Business Model
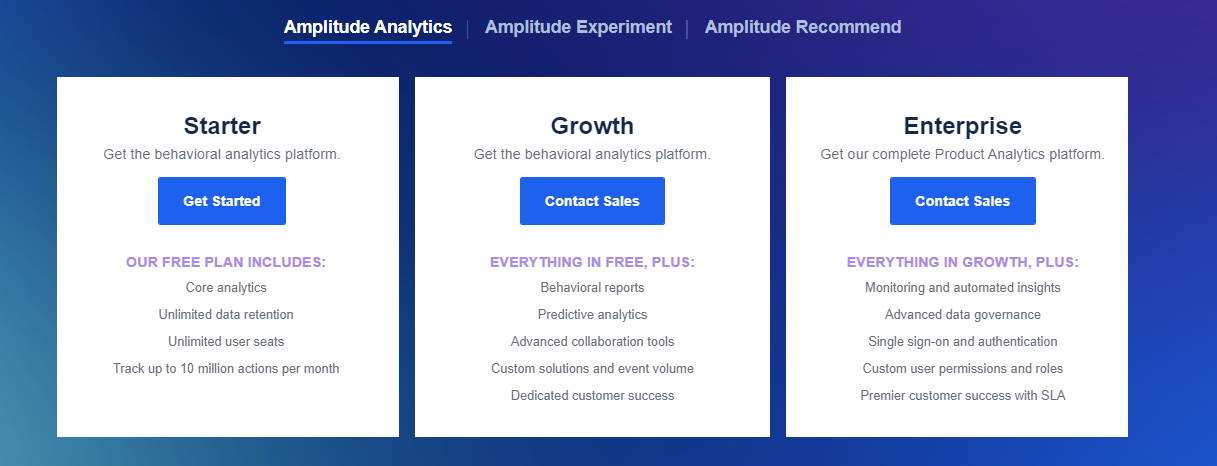
Amplitude generates revenue through a standard freemium SaaS model, where thereinafter pricing is based on 1) the functionality of the platform customers need and 2) committed "event volume" (# of customer actions tracked). There's no set price on subscriptions as it's done on a case-by-case basis, but customers report $995/month for Growth plans (which equates to ~$12k/year) and Enterprise plans are presumably $100k/year+ accounts.
Inherently, this means there's a semi usage-based component to pricing, and puts context behind why larger accounts make up quite a significant piece of revenue.
According to management, customers generally are first acquired through a subscription plan on Analytics, then expand into other products like Experiment and Recommend.
Amplitude also offers additional add-ons on top of their main Analytics offering; for example, if you're a SaaS company and want to track your total accounts or MRR, they offer an "Accounts" add-on.
Competition
Amplitude competes with any solution that enables businesses to track Web and Product analytics, with a stronger emphasis on the latter.
High-level: Compared to alternatives, there's a recurring theme that differentiates Amplitude: the robustness of its analytics relative to the competition. At every stage of use within the platform from configuration to dashboard customization, the platform is enterprise-grade. Amplitude's value proposition is automating product usage data collection and analysis, but in a way that is arguably as robust as a technical team.
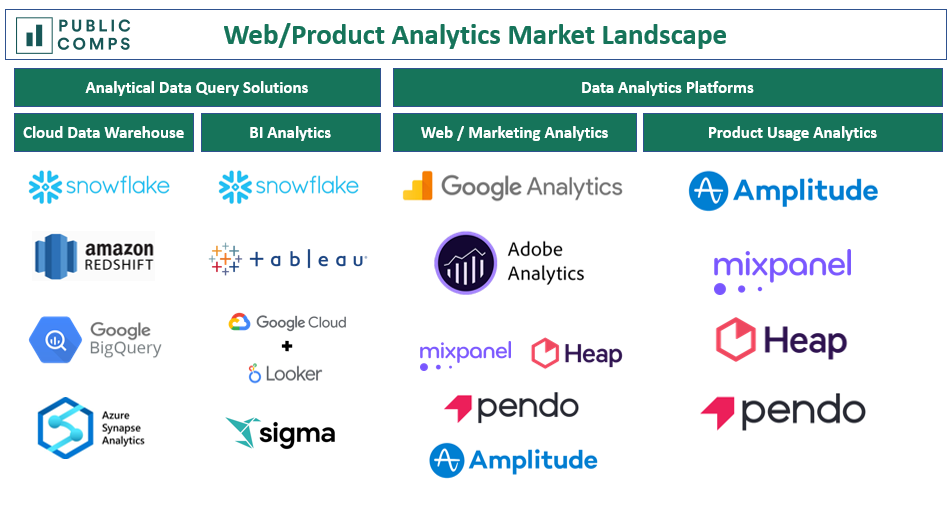
There are a couple of players that offer alternatives to Amplitude's platform I'll cover:
Web / marketing analytics
- Google Analytics: By far, the most widely used web analytics tool (used by ~30M live websites) because of Google's presence in the broader web. As a result, it's generally catered for tracking customer attribution (i.e. "page visit" data), rather than "click-based" data like Amplitude offers. The biggest advantage here is that it's free for users, which makes sense because of the integrations it has with Google Adwords.
- Adobe Analytics: Similar to Google Analytics in offering web and marketing analytics, as well as tools to track attribution across channels. In my view, they aren't direct competitors as Amplitude focuses more on customer data within digital platforms. In fact, Adobe and Amplitude partnered to integrate their solutions with one another, to "take analytics a step further".
Product usage analytics
- Heap Analytics: Arguably most similar to Amplitude, allowing engineering teams to track all events that take place on a page. Experts have noted it's very easy to configure. I see this as Amplitude's primary competitor from a product offering standpoint; that being said, Heap last raised its Series C ($55M) in 2019 and is estimated to be ~half the size of Amplitude in terms of headcount.
- Mixpanel: Product / Web analytics business that also operates on a freemium model, tracks user "events", and has built-in messaging capabilities that businesses can use to interact with customers. Customers have noted that there's an extensive amount of technical setup / maintenance, and consequently takes more time for teams to understand.
- Pendo: Although they offer similar product analytics solutions as Mixpanel, Pendo focuses more on building workflows for product management teams. They offer tools to collect product feedback from users to plan product roadmaps.
Analytical data query solutions
- Data warehouses like Snowflake and their integrations with business intelligence tools like Tableau also compete with Amplitude, because they can serve as alternatives. There's a variety of ways that businesses can piece together systems to do what Amplitude does, but it requires a significantly higher expenditure on resources like data scientists / developers.
Market Opportunity
Management claims the market for their platform in 2021 is $37B, estimated through a simple bottoms-up approach:
- Segment all businesses globally into cohorts by employee count: 100<; 100 - 1000; and >1000
- Apply an estimated penetration rate to each cohort
- Apply an ARR value using internal customer data to each cohort
Digital apps and services are exploding: In one way or another, every company in every industry is becoming a digital tech company. The IDC estimates that 500M+ apps and services will be deployed by 2023. To put that in perspective, that's a bigger number of apps/services than we've seen over the past 40 years. Software is indeed eating the world, and with that, platforms that enable businesses to become product-first are increasingly necessary.
Go-To-Market
- Direct Sales: It's clear that Amplitude places an emphasis on selling to larger enterprises: 26% of customers (>$100K ARR spend) account for 73% of the company's total ARR. From the S-1: "We believe there is continued significant opportunity to continue to penetrate the largest global organizations." Consequently, sales cycles are generally longer (four to six months), and large individual accounts can result in quite a bit of financial volatility.
- Channel Partners: Amplitude relies on third-party channel partners like independent software vendors and resellers to sell internationally (36% of revenue was generated outside of the US), which they're planning on further investing in. It's fair that they believe channel partners, which they equip with extensive training, are able to extend reach faster than an internal sales effort.
- Product-Led Growth: Similar to many current enterprise software companies, Amplitude allows people like you and me to easily self-service the product via their Starter plan. Additionally, Amplitude offers a Scholarship plan for startups to self-service a free one-year Growth plan. It's a compelling GTM strategy we've companies like Snowflake, Unity, and Crowdstrike use to 1) reduce CAC; 2) improve time to value; 3) collect data on initial product usage.
Business Performance & Benchmarks
Some key takeaways from Amplitude's business metrics benchmarked to the leading SaaS companies:
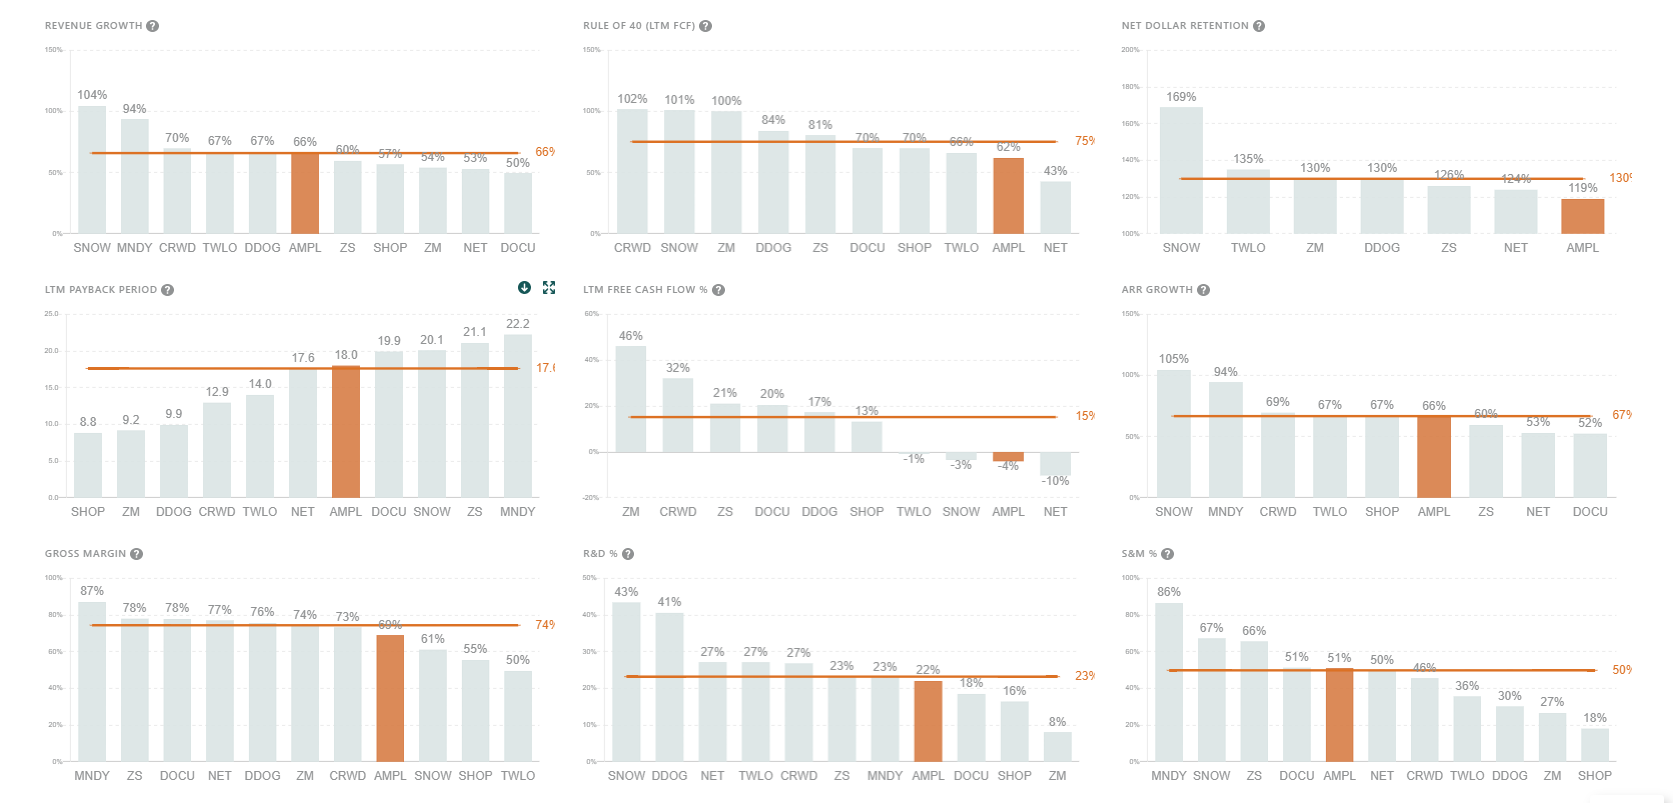
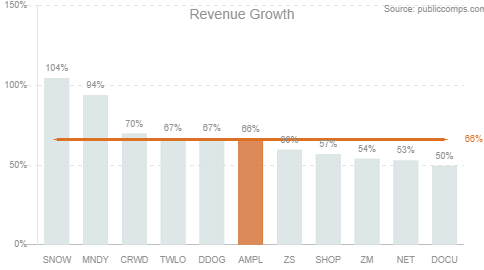
- Revenue growth: Amplitude is among the fastest-growing software companies, and the only public product analytics dedicated software. The business is currently running $157M ARRR growing 66% YoY, which puts it as the #6 fastest growing top 10 SaaS company, albeit on a smaller scale. They've averaged ~12.6% QoQ revenue growth over the past two years (with the exception of COVID's Q3 2020 quarter).
- Gross margins: Margins are typical of software businesses and fluctuate between 69% and 72% based on product usage. Fluctuations are mainly attributable to third-party hosting services needed to support Amplitude's platform. This means that when more customers use Amplitude's platform, hosting fees generally increase because the volume of data stored by Amplitude increases. However, it is worth noting that AMPL minimizes their hosting costs by sampling data (i.e. not all user events are stored).
- Dollar-based net retention rate (NRR): NRR is strong but lower than other enterprise software providers at 119%. Management prides themselves on customers experiencing the value of the Analytics platform and expanding beyond initial use cases, but I'm wondering how effective cross-selling their Experiment and Recommendation products if Amplitude's main proposition is its analytics platform. I wouldn't be surprised if upsell was the main driver of NRR.
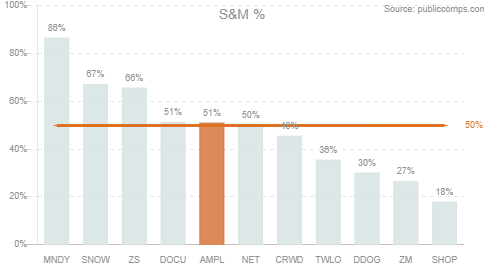
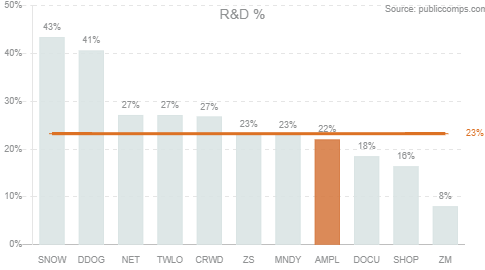
- S&M and R&D: S&M is high relative to R&D spend. Unsurprisingly, S&M is reasonably high because Amplitude is a horizontal product which requires a robust sales team to target its enterprise customers. S&M expense isn't expected to slow; plans to expand its international sales efforts might also keep this afloat. R&D isn't as big of an expenditure as a result, which is fair considering the capabilities they've built out over the past decade.
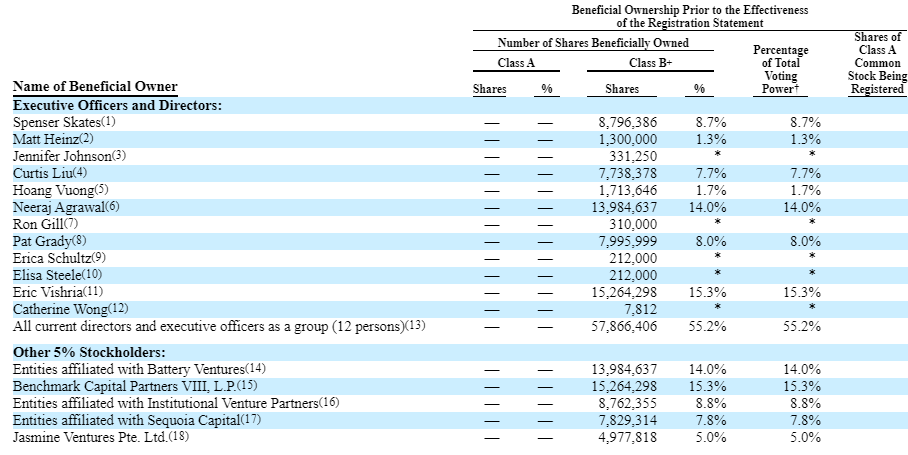
Ownership
Benchmark Capital owns the largest stake among institutional investors at 15.3%, followed by Battery Ventures at 14.0%, IVP at 8.8%, Sequoia at 7.8%, and Jasmine Ventures at a 5.0% stake.
Valuation
Given that Amplitude is the first product-analytics dedicated software company to go public, we can instead estimate what it will price at based on average high-growth SaaS companies. Average EV/NTM Revenue is 31.3x (see our real-time analyst estimates here) as of September 7th, 2021.
Specifically, we can look at software businesses that are growing revenue at a similar range as Amplitude such as Shopify, Unity, UI Path, and Okta. They trade for 27x-34x NTM revenue.
Amplitude posted ~$128M in LTM revenue, which represented +53% YoY growth. If we assume forward growth of +45% YoY (based on growth persistence of typical fast-growing SaaS businesses), we can approximate their NTM revenue to be ~$187M.
It's also important to keep in mind that Amplitude just raised a $150M Series F at a $4B pre-money valuation led by Sequoia in June before deciding to direct list, which can serve as a basis for our floor valuation (and is exactly what they wanted).
Applying the 27x-34x EV/NTM Revenue multiples, we believe it's reasonable that $AMPL will price at $5.0B-$6.4B when they officially go public.
Conclusion
Amplitude is a company riding the wave of digital transformation - further accelerated by COVID-19. Virtually all companies are going digital, and consequently, must continually satisfy the needs of their customers to remain dominant. We think Amplitude is at the core of this trend, and will only further benefit as companies become more product-driven.
Huge congratulations to Amplitude, their investors, and for all they've accomplished!
Any feedback/thoughts/requests would be greatly appreciated! Feel free to reach out: jimmy@publiccomps.com!
Jimmy Zhou, Public Comps Team (@jimmynzhou on Twitter)