Data Tooling Market — 2019
Today we give an overview of the state of data tools in 2019 as well as interesting opportunities for investors and founders that in the data tooling stack.

As a startup founder who spends a lot of time in Jupyter notebook and building data pipelines for Publiccomps.com (SaaS Metrics for Public Software Companies), I’ve evaluated and tried a bunch of tools geared towards data scientist and data engineers. I’ve also spent time a fair amount of time in the past with founders in the data science/tooling market as a former VC at Signalfire and Insight Venture Partners.
Today we give an overview of the state of data tools in 2019 as well as interesting opportunities for investors and founders that in the data tooling stack.

Data Team Functions
Taking a step back, what’s the point of a data team anyways? Why build all these integrations and invest in fancy cloud data warehouses and data science collaboration products?
I put the function of data teams in 3 buckets:
- Data pipelines
- Data exploration & building models for application
- Building a report for a decision maker using BI/Analytics Tools
See the Appendix for how we delineate data scientist, data analyst, business users and data engineers!
Data Pipelines
In order to build a model or create a report, a modern data team needs to have the cloud data infrastructure in place which involves pulling data from the various data sources. Data sources include SaaS applications like Salesforce, Shopify, Stripe Payments data, email, excel spreadsheets, and customer data stored in MySQL. Data ultimately needs to be moved into a data store like AWS S3 or cloud data warehouses like Snowflake or AWS Redshift. The work involved with regularly replicating, cleaning or preparing the data from the SaaS applications or databases into a data warehouse is the data pipeline.

For processing large datasets, customers can use Databricks to leverage Spark to run data processing concurrently to reduce data processing time. Companies like Pachyderm and DVC allow data teams to version control their data so data scientist who want to run machine learning models can reproduce their work on even if the underlying datasets change.
Building Models
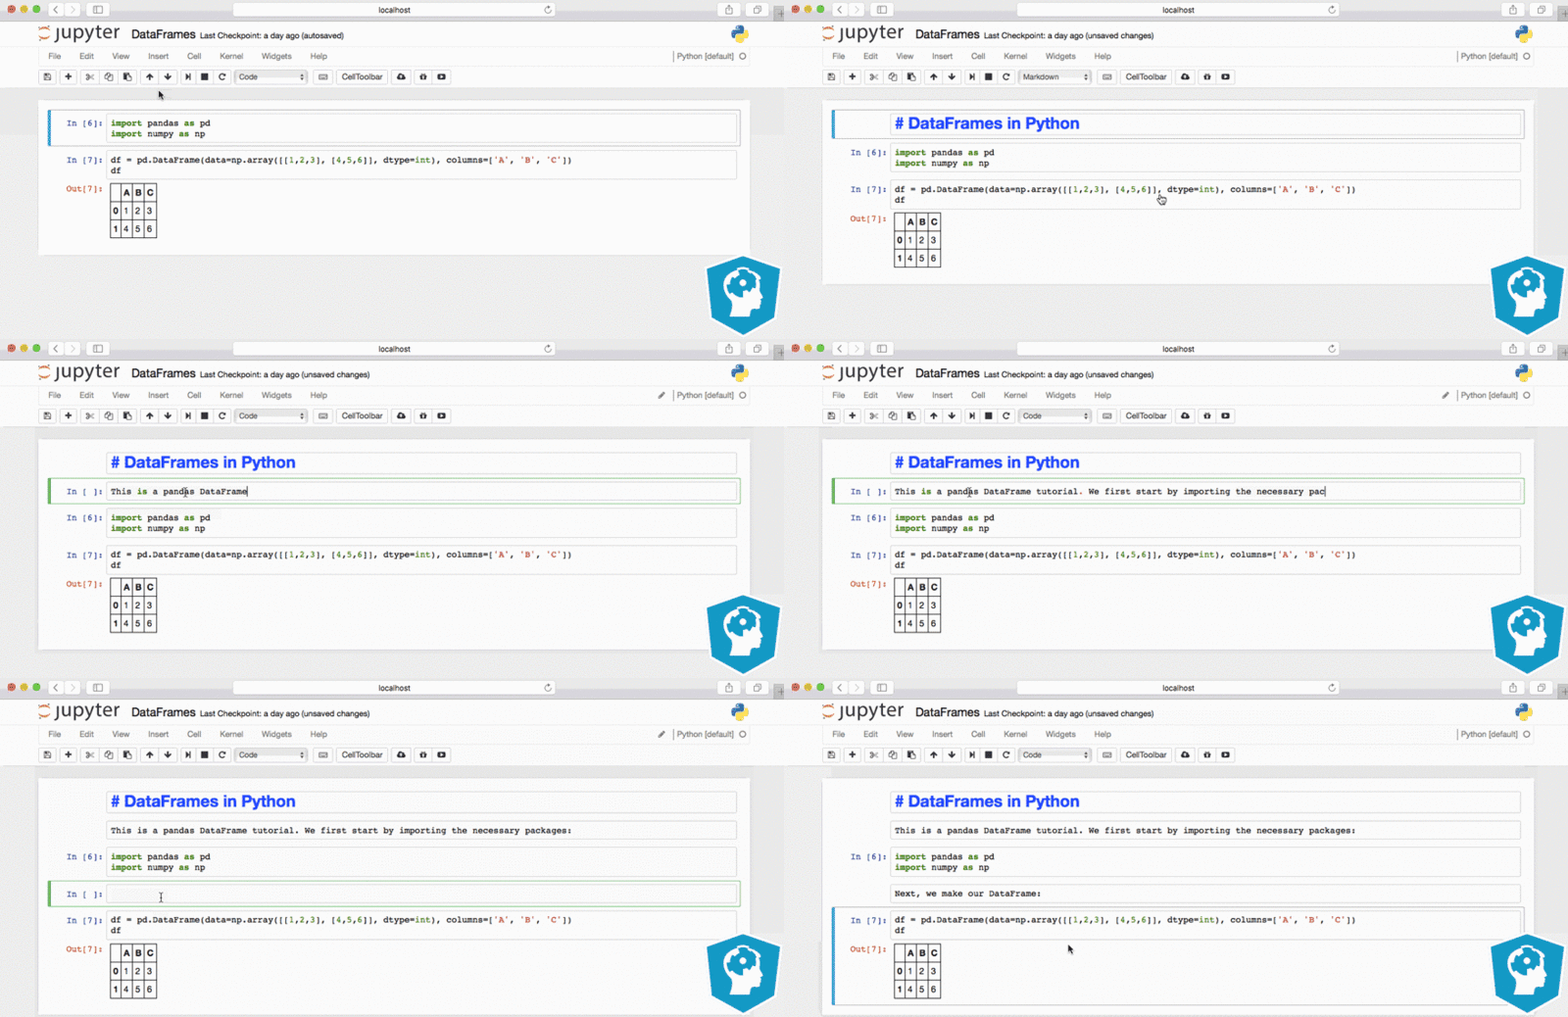
The various software vendors like Dataiku, Domino Data Lab, Databricks, Saturn Cloud, and RStudio allow data scientist to work together and collaborate in the model building phase. From talking to data scientists at tech companies, most of them work in different IDEs (Integrated Development Environment) depending on their preferences for RStudio, Apache Zeppelin, Terminal, Jupyter Notebook, or Databricks.

Before getting insight from the data or deciding which feature to include in their model, data teams will need to explore the data by graphing the data or seeing the visual representation of features effect on dependent variable. Then there’s the actual model building of leveraging open source machine learning libraries such as sci-kit learn or Tensorflow and applying the models on top of the data that came out of the data pipelines. Teams can manage models by using products like Domino Data Lab, Datarobot or Pachyderm to ensure teams are working on the latest model or dataset.
Lastly, companies like Algorithmia, Domino, or Alteryx (Yhat) make it easy to convert the R, Python, Scala code into production level code so the engineering team can deploy models into the live production application.
Reporting (BI/Analytics Tools)
Majority of the work that a data team does is pulling relevant data from various data silos and to create a report that a business user can then make a decision on.
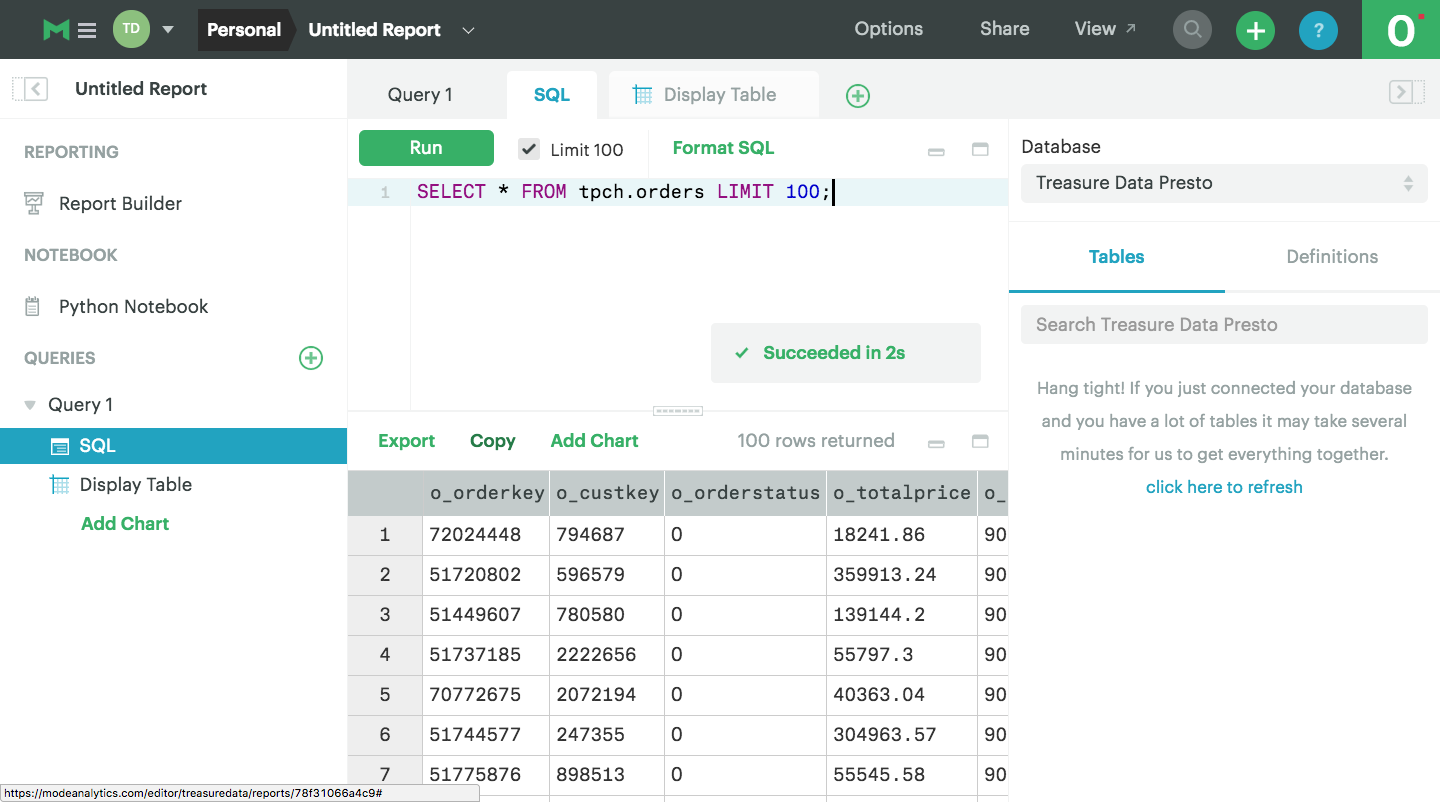
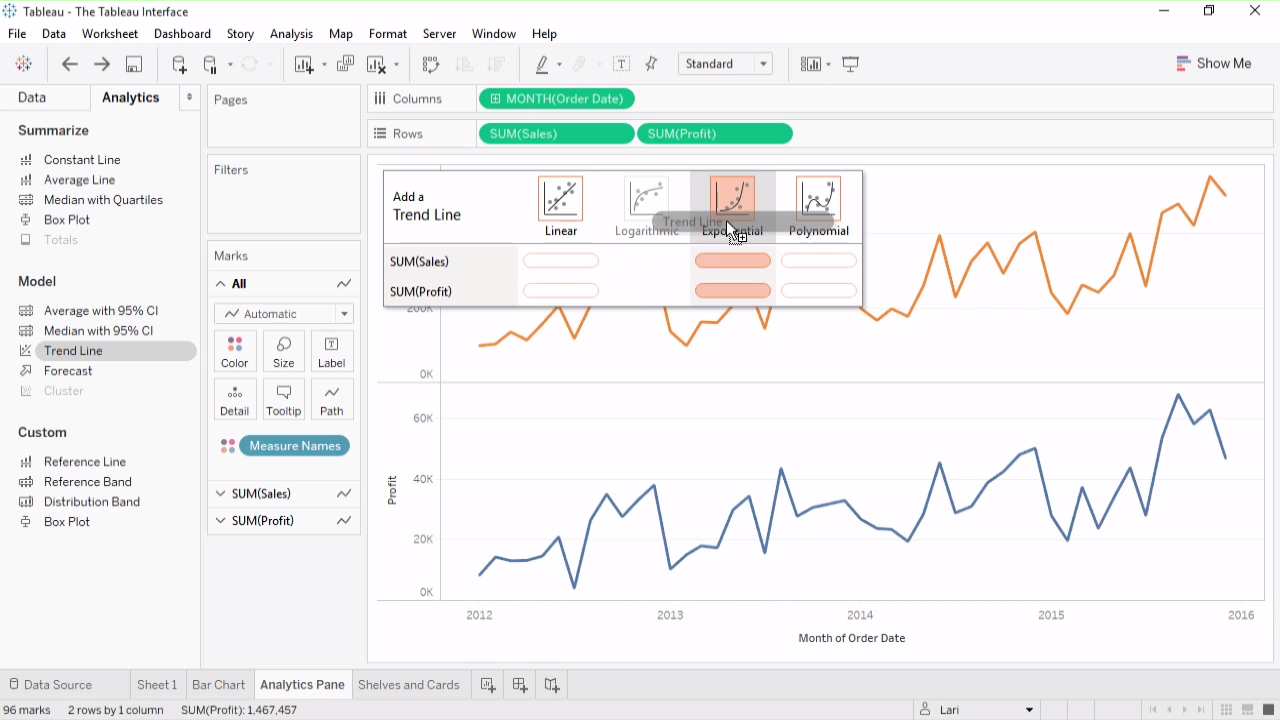
Given clean data from the data pipeline, the next step is for the data analyst to leverage next gen BI/Analytic tools to pull the relevant data in SQL and graph the information in a Periscope Data, Mode, Chartio or for a business user to use traditional or drag-and-drop BI/Analytics tool to create graphs in Tableau (acq. Salesforce), Microsoft PowerBI, Microstrategy, etc.


But in most cases, the business user or data analyst is dealing with messy data living in spreadsheets or different databases, and so may need to reach for an Alteryx or data preparation tool to clean the data before it’s ready to be visualized.

Market Activity
There’s been a lot of activity across the various tools in the modern data stack.
- Cloud Data Warehouse: Snowflake, a leading cloud data warehouse, continues to growing 250%+ in revenue with 1,500+ employees. Amazon AWS is expected to do $44b in revenue in 2020 while continuing to grow 49% YoY (if AWS was a standalone public company, AWS would be a top 80th percentile growth SaaS company!). Clearly companies are quickly migrating their data from on-premise databases and data warehouses into cloud data warehouses to allow business users to draw insights more quickly.
- Cloud Data Pipelines: Matillion, a cloud ETL business, raised $35m Series C in Q2 2019 while continuing to grow at triple-digit growth. There’s been a lot of M&A activity in this market with Talend acquiring Stitch in Q4 2018 for $60m and Google Cloud acquiring Alooma for $150m in Q1 2019. It seems like the cloud vendors view ETL as a strategic market because they need the ETL vendors to do the dirty work of building connectors and helping customers get value out of the data warehouses by piping in data through the connectors. Companies are also building their data pipelines on top of Databricks which raised $250m in Q1 2019 and the company behind Spark.
- Cloud Data Science Platforms: Domino Data Lab ranked #289 on Inc’s 5000 list, Dataiku raised $101m in Q4 2018 from ICONIQ Capital and was named to the Forbes Top 100 cloud list for 2019, Datarobot raises $200m Series E in Q2 2019 led by Sapphire Revenues. Oracle bought Datascience.com in Q2 2018. The amount of funding into these businesses suggest the data science collaboration market is growing quickly and customers are adopting these products.
- Cloud Business Intelligence Tools: Tableau was acquired by Salesforce for $15.7B in Q2 2019, Periscope Data and SiSense merged in Q2 2019 for a combined ARR of $100m+, Looker was bought by Google for $2.6b and analyst estimate Looker’s 2019 revenue is ~$140m. The flurry of BI acquisitions suggests opportunity for independent players to step up particularly if Tableau and Looker’s integrations don’t go well. Because Google is likely going to nudge Looker customers to Google’s BigQuery product, I expect Looker customers on Snowflake, AWS Redshift or Microsoft Azure to consider other products in the market.
- Open Source Data Science: the number of R and Python data science users continues to grow exponentially given their both free and open source products (see Google Trend below). RStudio, which develops the popular IDE for R, has some of the leading enterprises like Walmart, Santander, Libery Mutual and Samsung as paying customers. Similarly, Anaconda which builds an enterprise version of Jupyter Notebooks and distributed of Python and R data science libraries, has large enterprise customers like Citi, BMW, Cisco, etc. Its interesting to see these open source commercial players dislodging SAP Business Object Business Intelligence Suite and IBM SPSS Statistical Analysis which were what most enterprises were traditionally mostly using.

Interesting Areas and Solutions
1) Cloud ETL Pipelines: the engineers hate having to manually build connectors to web application APIs or data sources which is required to move the data into the cloud data warehouses. Companies like Matillion and Fivetran have pre-built connectors with cloud applications which saves tech teams a lot of engineering time from having to read through API documentation for all the different types of SaaS applications. Similar to what we saw with Informatica and Talend for on-prem data warehouses, I believe there will be some large stand alone businesses in the cloud ETL pipeline market.
2) Analytics in the Cloud: Most companies require pulling data from their cloud data warehouse to their local machines before they’re able to run analysis. Tools like Sigma Computing that integrate nicely with Snowflake allow analysts to run their analysis on top of the cloud data warehouse and without having to write SQL queries which enables faster analytics for even non-technical analysts.
3) Data Science Collaboration: Most existing workflows require data scientists or data analysts to save their files, models or reports locally before sharing. Tools like Domino and Dataiku target enterprises and allow data scientists and data analyst to collaborate in a cloud-based interface so work doesn’t get loss and models can be re-run reliably.
Dataiku is particularly interesting because it spans across Data/Business analyst (e.g data exploration/visualizations, drag-and-drop modeling, data preparation similar to Alteryx), Data engineers (connectors and integrations with SaaS and data sources), Data Scientist (model building, model deployment, manage reproducibility) and the Analytics Leaders (tracking projects). My understanding is that Domino Data Lab focuses exclusively on data scientists who write code and really helps enterprises with managing models, version control of data sets, and making it easy to deploy models into production. The reach of Dataiku seems particularly vast as anyone on the data team could be a user of the product.
4) Version Controlling of Data: Some of the best tools that have worked for developers don’t quite work for data scientists. Version controlling for code with git doesn’t work the same as version control for design files (e.g images) or data files (e.g csv, excel, dataframes). For example, I tried using Github to manage my notebooks and my data files for Publiccomps.com, and it’s a mess to figure out what the different versions mean. Companies like Pachyderm and DVC (both open source) aim to solve this problem and are also able to get into model management as well since they can manage the life cycle of all your data and are language agnostic.
5) Managing and Executing Analytics/SQL Scripts: Before graphing data, the first step is to pull the data from a database writing SQL. I used to store these SQL scripts in a Google doc and would search through the doc every time I had to re-run or write a complex query. There was a lot of copying and pasting and sometimes I would just re-write SQL queries from scratch. It was messy and painful. Luckily, DBT(Fishtown Analytics) solves this problem by providing an easy way to manage and execute SQL scripts needed for transforming data already in a data warehouse for Analytics/BI tools. The best analogy is thinking of dbt as providing “Jinja” for SQL queries: instead of having to copy-and-paste SQL queries in your scripts, you can use templates and reusable data models to build complex analytics queries. DBT doesn’t do the extract (e.g building connectors) or load step in ETL/ELT, but instead focuses on the transform step which I would argue is the most difficult and time consuming step for data teams. I’m particularly excited about dbt because they’re helping data analysts benefit from the best software engineering principles like version controlling, modularity, staging, and unit testing by introducing these principles in the SQL paradigm.
6) Tools for Business Users: One of my favorite products is Metabase which is a free and open source BI tool that functions a lot like Tableau. It takes <5 minutes to set up and to get up and running. Like Tableau, Metabase appeals to the business user who doesn’t know SQL but wants to be able to get insights from a database quickly. Notice that in the Nextgen BI/Analytics market, most of the players are geared towards users who know SQL (e.g PopSQL, Mode, Periscope, etc) though they are starting to offer functionality that allow users to drag and drop and get insights without having to write SQL. Thoughtspot also has a strong solution in this market — their product allows users to search in natural language (“what were sales last year”) and get visualizations without having to write SQL or code.
7) Self-Services Hosted Notebooks: It seems like individual data scientists have been largely neglected by the enterprise software companies. It’s a pain to have to follow a guide to get a Jupyter notebook up and running on AWS just so I can run code on AWS’s servers instead of on my own laptop. I’m a huge fan of Saturn Cloud because similar to Metabase, I was able to get it up in running in <5 minutes. What’s really nice was that I didn’t have to SSH into the machine in order to migrate my Jupyter notebooks to Saturn: I could simply upload the data and notebooks with their UI.
Closing Thoughts
My hypothesis is that tools for developers have come along quite well from version control (Github, Gitlab), infrastructure workflow set up (Hashicorp), infra/application monitoring (New Relic/Datadog), session recording (Logrocket/Fullstory), to log management (Sumo/LogDna) but for some reason data scientists and data engineers have been left behind. Perhaps its because of the different paradigm (code for application and infrastructure is different than SQL scripts or Python/R code for data pipelines and analytics). I’m really excited to see all the new developments in this market over the coming years!
Special thank you to Michael Chiang at Twitch, Chetan at Benchmark, Anna at Airbnb, Victor at Komodo Health, Andy at Stripe and others for their feedback. This is very much a living document where I’ll continue to update with new information!
Appendix
What are the different types of roles on data teams?
1) Data Scientist: statistician by training who is either building a machine learning model that can be used into the end production application (e.g Netflix recommendation system) or is doing more sophisticated data analysis for large scale datasets
3) Data Engineer: sets up the data warehouse or infrastructure so data analysts can reliably pull data into the BI/visualization tool of choice from a company’s disparate data sources. Work involves setting up the data pipelines that extracts data from the various data sources, loads the data into a data warehouse, and potentially transforming the data for the data analyst to analyze.
5) Data Analyst: builds a report by analyzing data to help answer a business question for decision makers (e.g what is the 12 month customer retention of Netflix users by city or demographic) that typically requires SQL and data wrangling with Python.
6) Business Analyst: there’s roughly 750m Excel users. Business users are the typical excel users who don’t code or can’t write SQL.
