Datadog IPO & S-1 Teardown
In this post, we summarize Datadog’s S-1. We benchmark Datadog’s metrics against its competitors and SaaS peers to contextualize why Datadog is such a phenomenal business.

I worked in venture for 4 years at Insight Partners ($20 billion AUM software focused fund) and Signalfire ($800m AUM) where I focused on investing in growth-stage SaaS companies.
It was no secret that Datadog was one of the best private SaaS companies. Datadog’s S-1 made me realize what a truly amazing business it is.
In this post, we summarize Datadog’s S-1. Our philosophy at PublicComps.com (SaaS metrics for Public Companies) is that numbers don’t mean anything by themselves. So in this blog post, we benchmark Datadog’s metrics against its competitors and SaaS peers to contextualize why Datadog is such a phenomenal business.

Problem
Prior to Datadog, the co-founders Olivier and Alexis led the development team and the technical operations team respectively at Wireless Generation. The database the two had to work with and maintain was called “Datadog” — hence the name of the company. Alexis and Olivier realized that there was a lot of friction between the developers who were writing code and the technical operations team who were making sure the code ran properly. There wasn’t a common set of tools or metrics that both the developers and operations team could look at to monitor the health of the same system they were all using. Was it the code or was it the test or infrastructure that was to blame when the websites slowed for users?
Additionally, in 2010 when Oliver and Alexis started Datadog, companies were just starting to move move from legacy on-premise IT to public & private cloud products like AWS. Because companies were starting to deploy updates to their websites in days instead of months, teams needed a way to observe their cloud infrastructure in real-time (“observability”). To complicate things further, there was a shift from monolithic code bases to distributed systems that leveraged micro services and containers which made monitoring the thousands of servers and hosts very painful for the IT teams and developers.
Product Overview
Datadog is cloud-native software product that allows IT teams, developers, and business teams to collaborate, monitor and analyze the health and performance of cloud infrastructure and applications to make sure their digital products are working properly.
Additionally, Datadog claims to be the first company to allow end-to-end monitoring and analytics by providing products across infrastructure & application performance monitoring, log management, user experience monitoring, and network performance monitoring. The company focuses on providing a unified view of a company’s entire tech stack in one product vs metrics living in different dashboards or solutions.
Timeline of Datadog’s various product lines from its S-1
- 2010: Founded in 2010
- 2012: Launched Datadog Infrastructure Monitoring
- 2014: Began monitoring containers
- 2016: Began monitoring serverless environments
- 2017: Launched Datadog APM
- 2018: Launched Datadog Log Management and Analytics
- 2019: Launched Datadog Synthetics
- 2019: Announced beta availability of Datadog Network Performance Monitoring and Real User Monitoring
Key Product Highlights
Easy to Integrate: At its core, Datadog integrates seamlessly to the entire tech stack ranging from cloud vendors (AWS, Azure, Google Cloud Platform, Alibaba Cloud), databases (Postgres, MySQL, MongoDB), automation tools/source control (CircleCI, Bitbucket, Gitlab, Github), other monitoring services (New Relic), containers (Docker, Kubernetes, etc), bug tracking (Jira), etc. With the 350+ integrations, Datadog is able to pull and surface all the metrics that matter for the different services that make cloud applications and infrastructure work. The value for customers is that they’re able to integrate data sources or vendors in minutes versus requiring engineering resources that could take hours to add, say, MongoDB or Kubernetes as services to track.
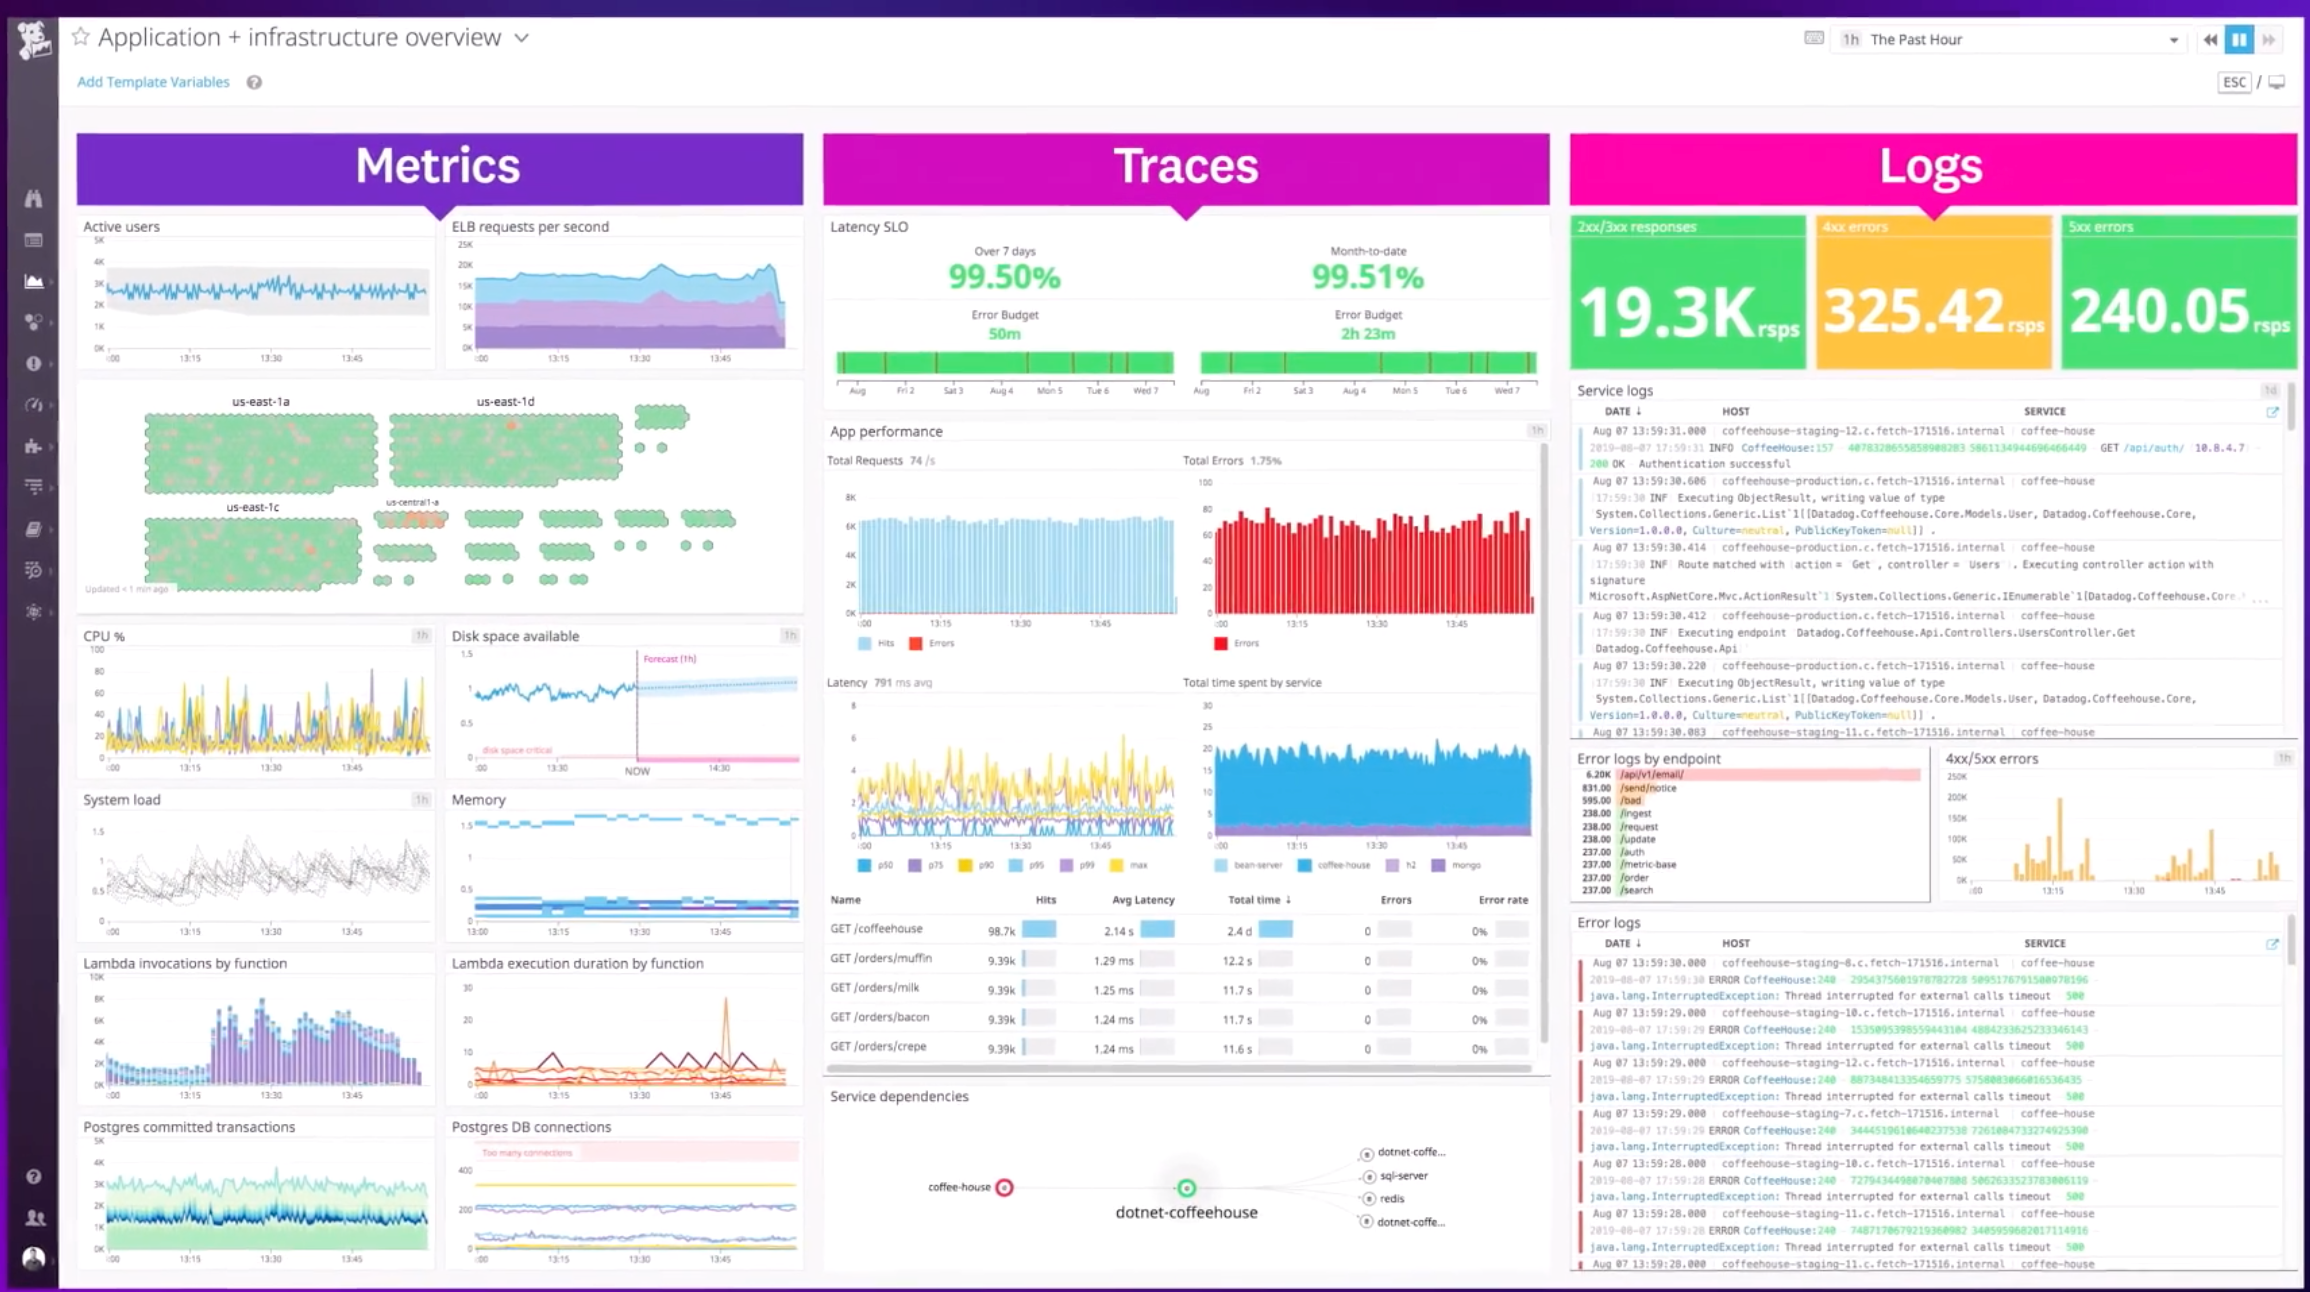
Dashboard of Metrics: Datadog allows teams to put the core metrics that matter for their infrastructure & application onto a single dashboard. Instead of having to dig into specific metrics that different vendors spit out, Datadog allows users to see what’s going on at all times with their entire tech stack. The company provides an easy and simple way to drag and drop metrics onto a dashboard. Because of their log management product, Datadog is also powerful enough for developers to drill into specific logs to debug why a specific service became so slow.
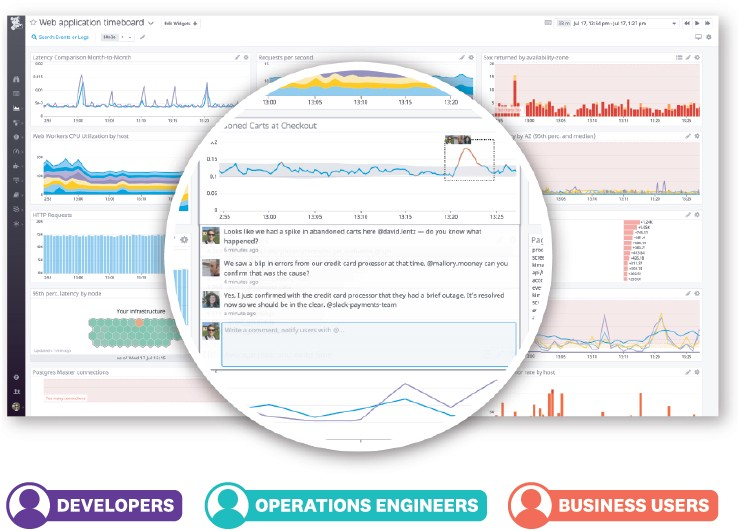
Collaboration: The team at Datadog really emphasize the importance of breaking the traditional silos that Alexis and Olivier dealt with at Wireless Generation between the IT operations and developers. Because Datadog is a single dashboard that integrates across the entire tech stack, developers, IT, business users can investigate collaboratively and have a joint understanding of the health of their application & infrastructure. When there’s a spike in, say, query latency, someone on the IT team can make a comment and notify a developer and share what the IT team is seeing.
Cloud Agnostic: It’s worth noting that while AWS, Google Cloud Platform, Azure offer some sort of cloud monitoring solutions (e.g AWS has AWS Cloud Watch), Datadog is cloud agnostic and works across cloud vendors.
Alerts: Datadog integrates with 3rd party issue & incidence response tools like Pagerduty and communication platforms like Slack. In the spirit of collaboration, Datadog can automatically notify a developer or IT team on Slack if there’s a performance problem and allow users to trigger or resolve problems within Pagerduty or Servicenow.
Business Model
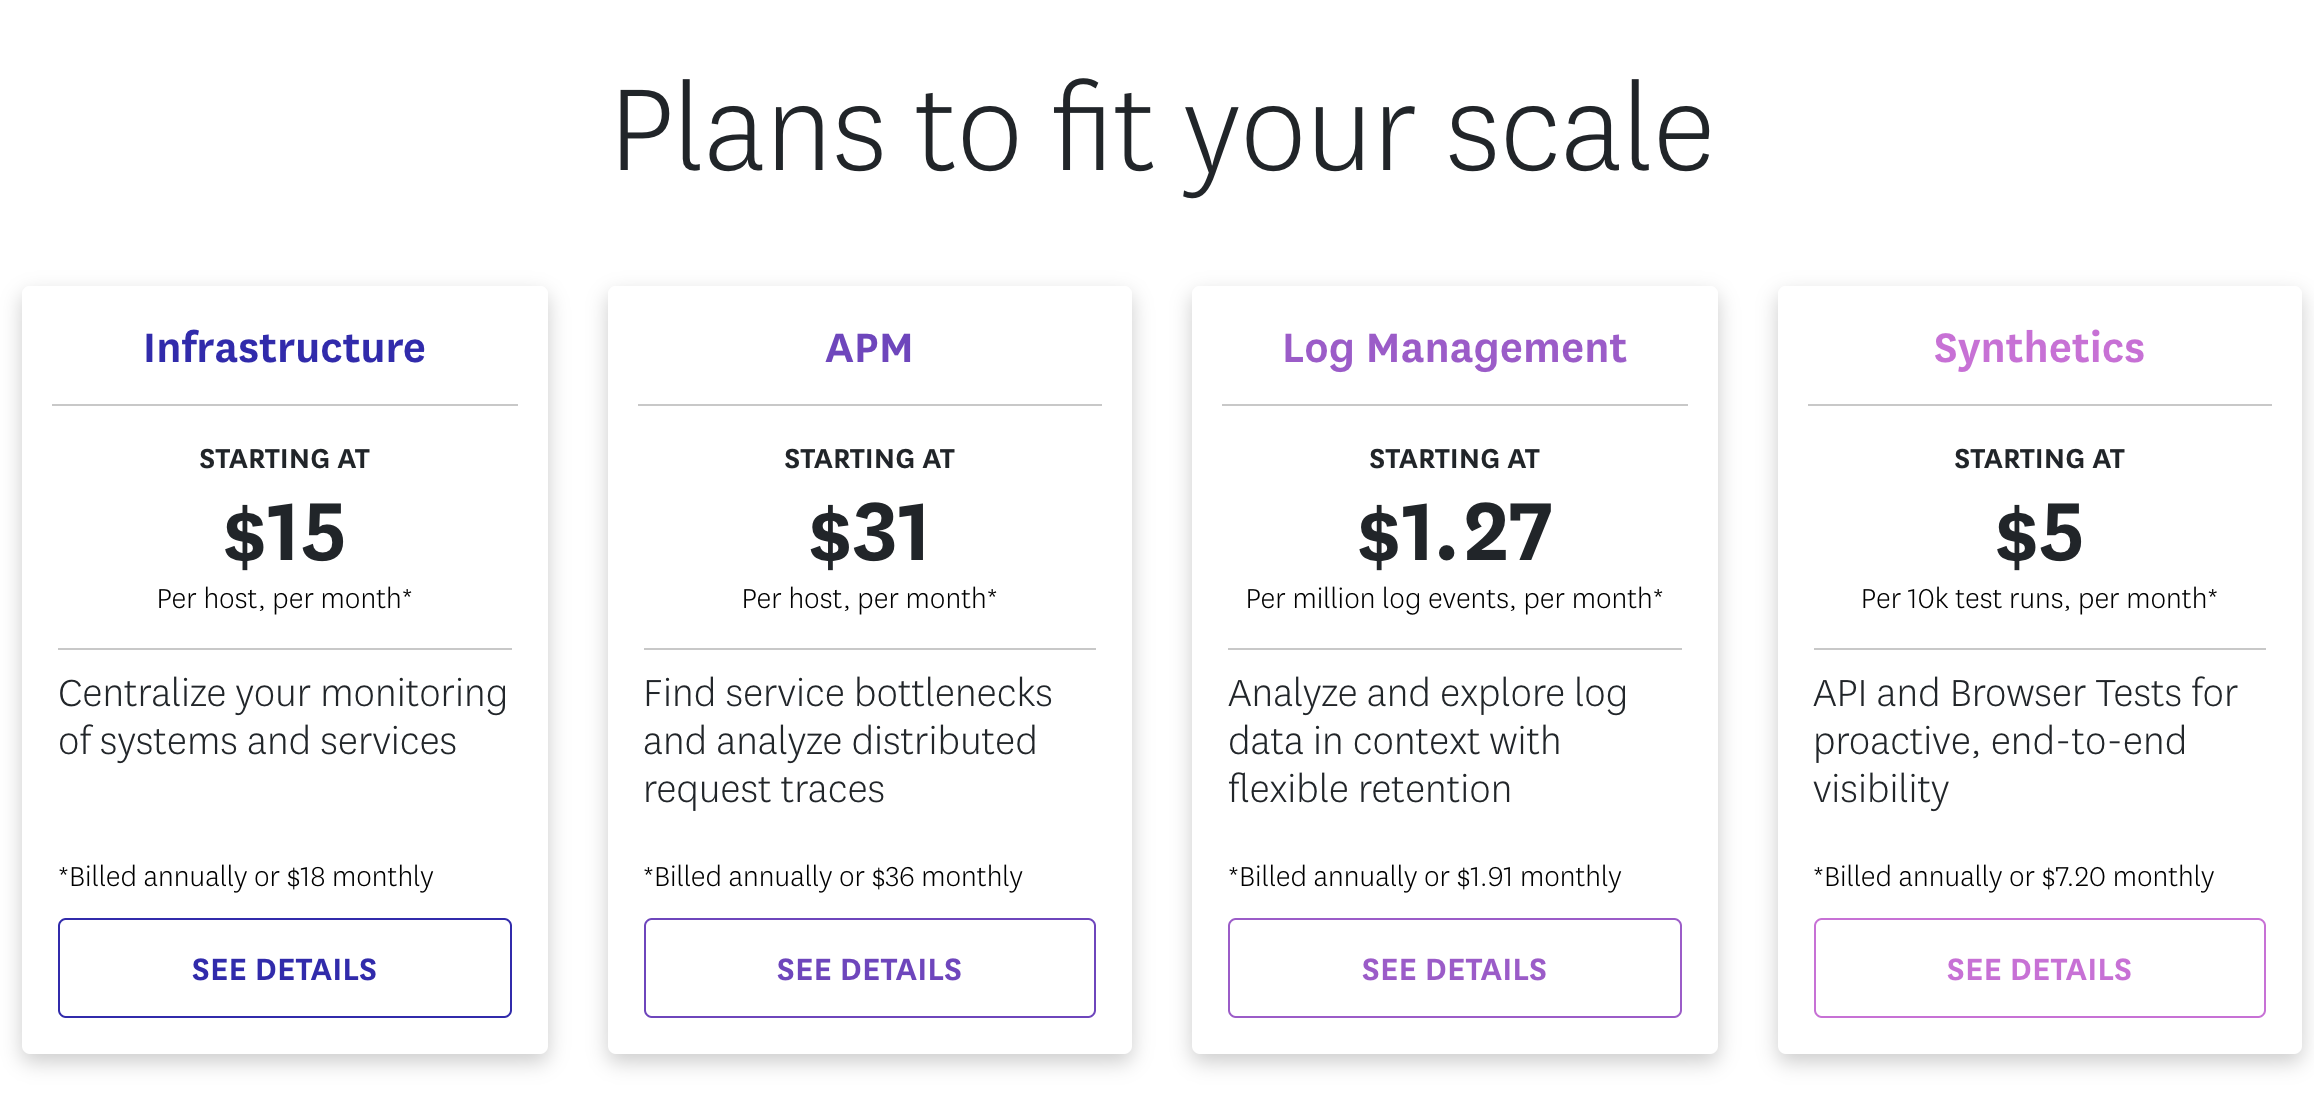
Datadog charges a subscription fee for its various products on a monthly or annual contract basis. Majority of Datadog’s revenue is subscription software sales so revenue run rate ~ annual recurring revenue (ARR). It’s worth noting that because Datadog doesn’t charge by seat, the company incentivizes companies to add more IT members, developers or business users to the product which drives adoption within organizations.
Go-To-Market (GTM)
Datadog has a highly efficient go-to-market model. In its S-1, Datadog talks a lot its land-and-expand business model focusing on a product that’s easy to adopt (hence the many out-of-the-box integrations Datadog offers) and with a short time to value. Not surprisingly, Datadog has a self-service and free trial model which allows any customer to integrate Datadog into various data sources for 14 days without requiring a credit card — reducing the friction of signing up and getting value right away.
Additionally, Datadog has an inside sales team and enterprise sales force. The customer success team is in charge of renewals and upsells. As we’ll see in the next section, the efficient GTM and land-and-expand nature of its cloud offering has lead to best-in-class payback period and net dollar retention.
Business Performance & Financials
In analyzing Datadog, we focus on the metrics that matter most for SaaS companies: Revenue, Revenue Growth Rate, Gross Margin, Retention, Payback Period, and Profitability/Capital Efficiency. Check out my article “Top 5 SaaS Metrics that VCs Look At” to understand the how & why behind the metrics.
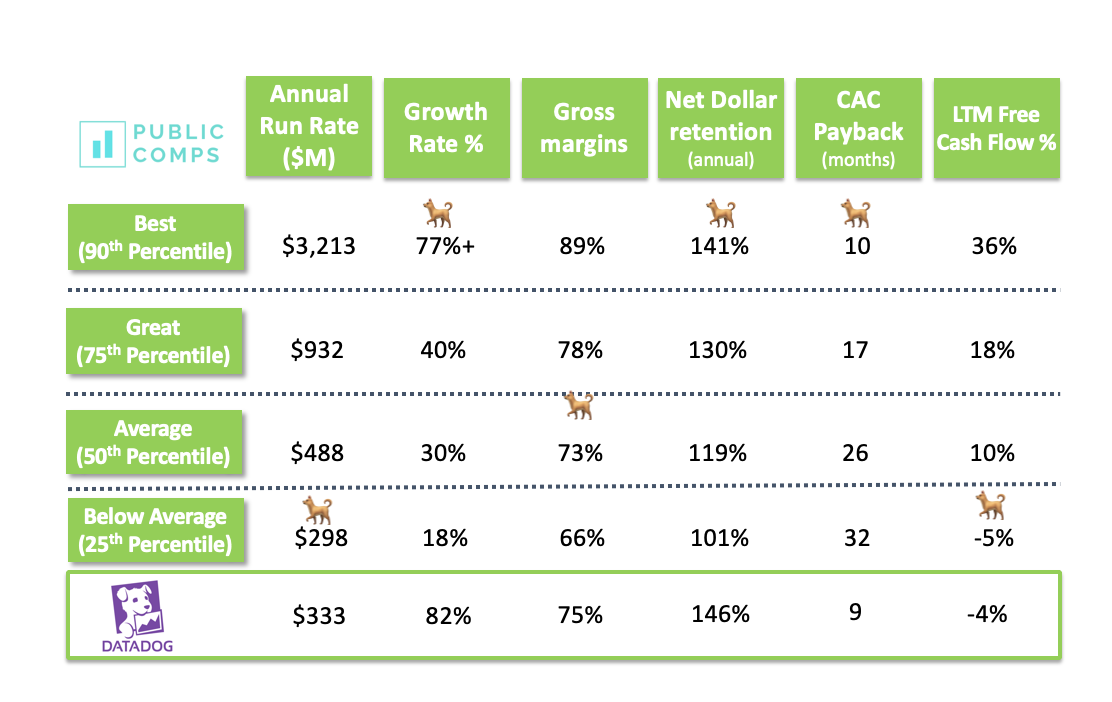
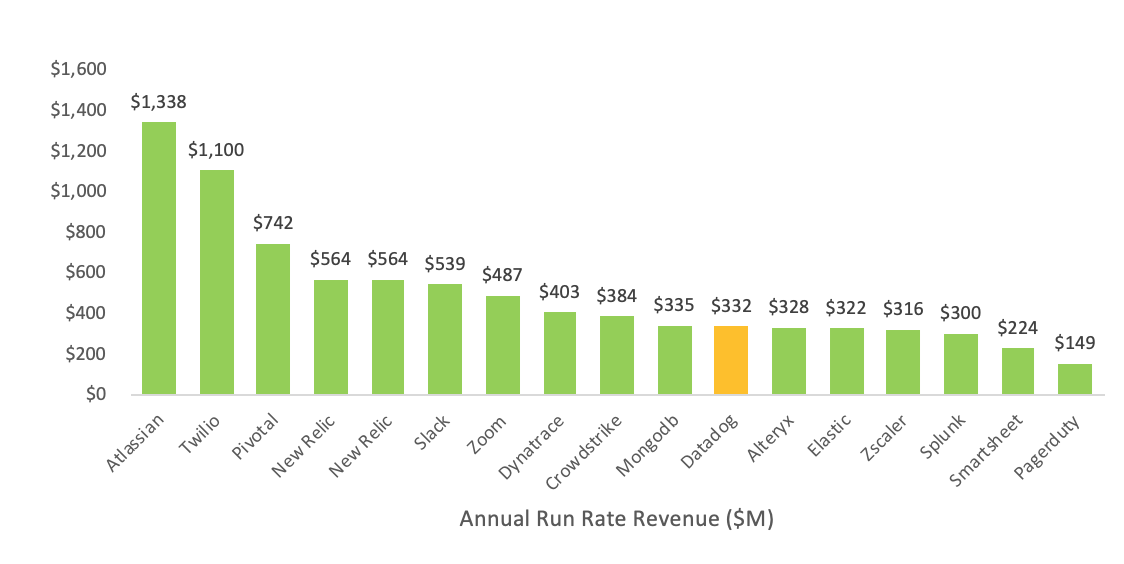
Revenue: At $332m ARR, Datadog is definitely on the smaller side relative to all Public SaaS companies (e.g Salesforce is $16b annual revenue run rate) but DDOG in the same $300–500m ARR range as other high growth SaaS companies like Crowdstrike, Zoom, Elastic, Alteryx, MongoDb.
Datadog added $52.7m in its most recent quarter and in the last 4 quarters it added $150m ARR which is quite impressive. Further, Datadog is seeing an increase in net new ARR in the last 4 quarters ($52.7m net new ARR June ’19 up from $33.8m Mar ’19) which is always a positive sign of continued growth.
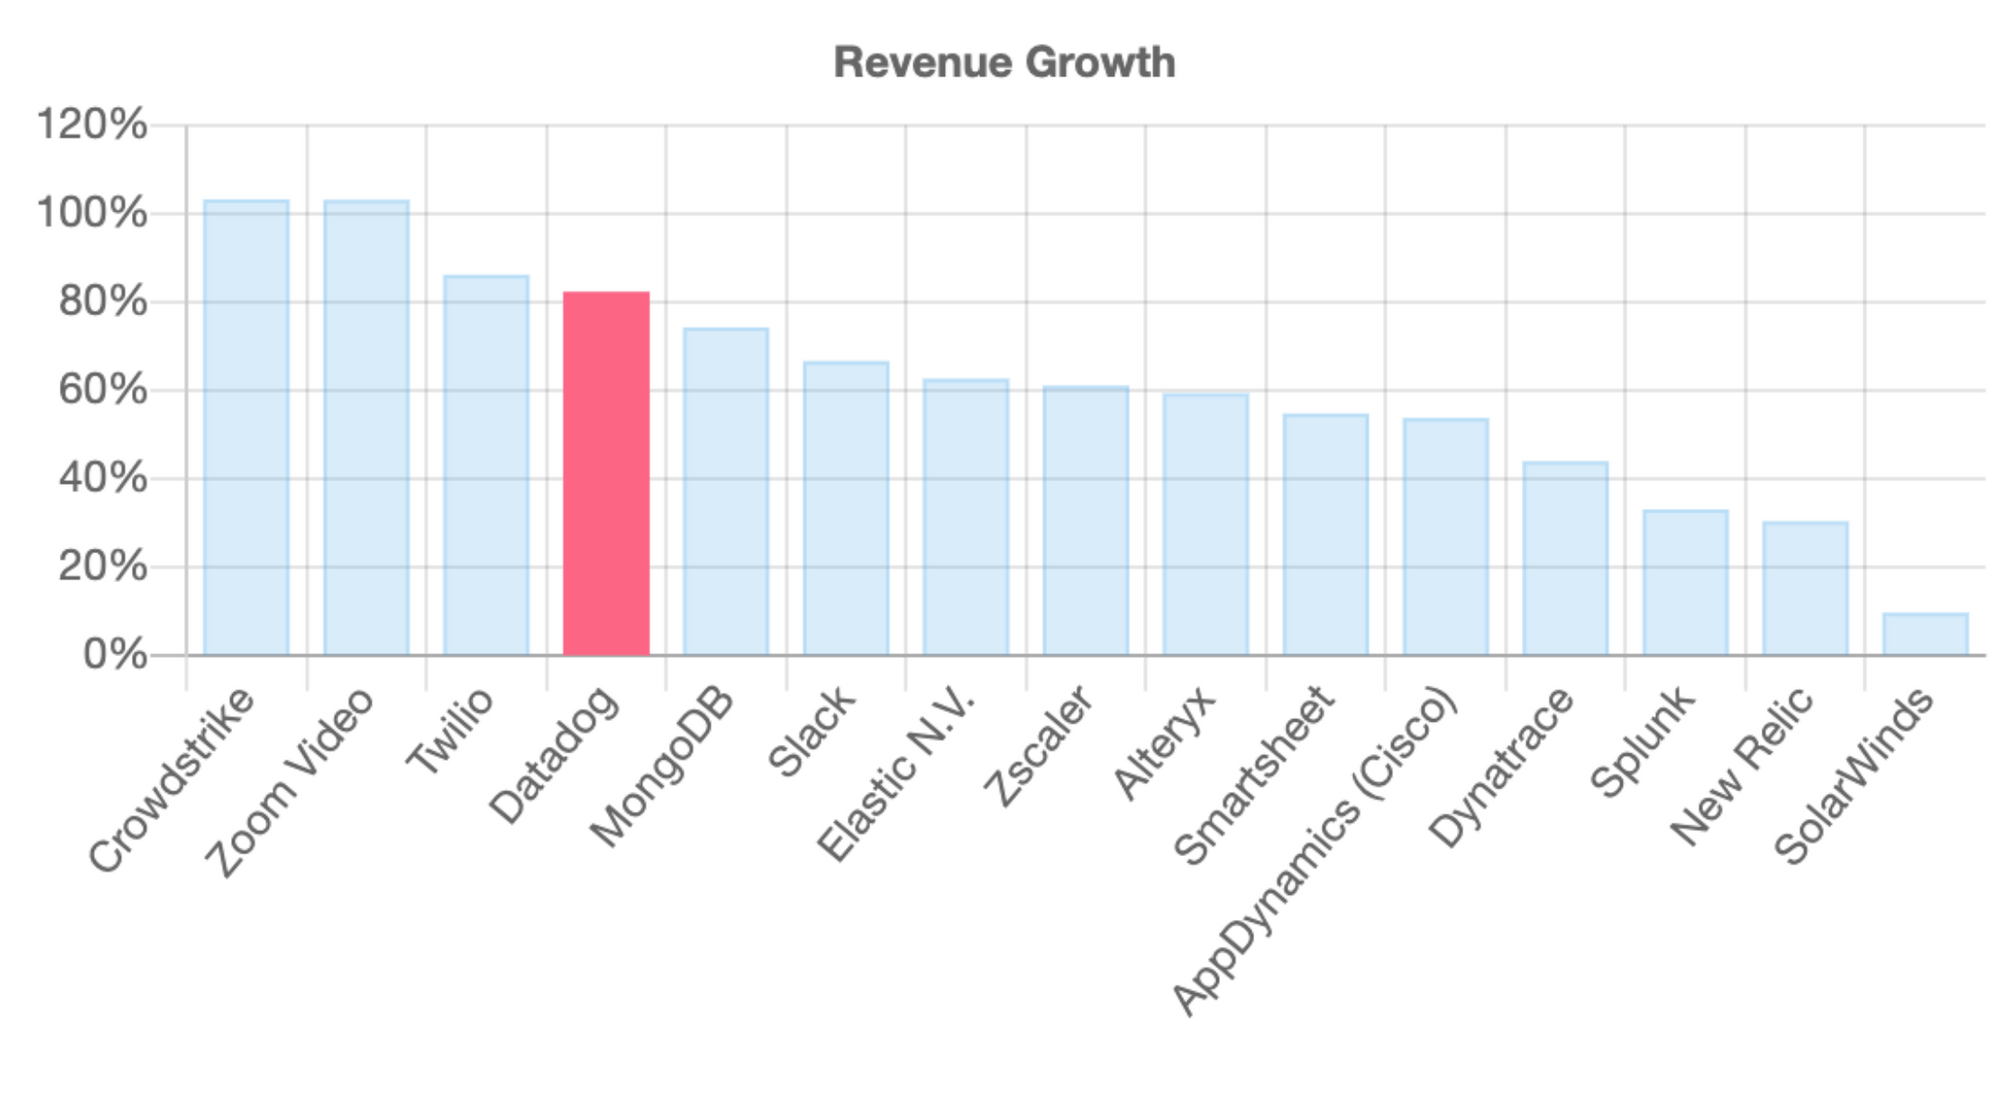
Growth Rate: At 82% year-over-year ARR growth, Datadog is the 4th Fastest-Growing Public SaaS company and fastest growing DevOps company.
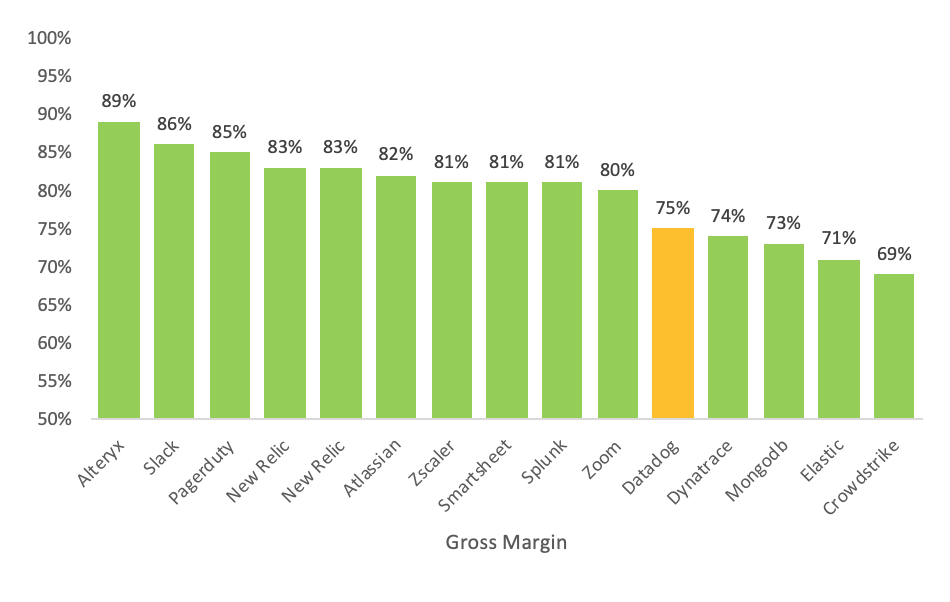
Gross Margin: Datadog has slightly lower gross margins than the typical SaaS company because of the cost of having to pay 3rd party cloud vendors to store all the data that they capture on behalf of their customers.
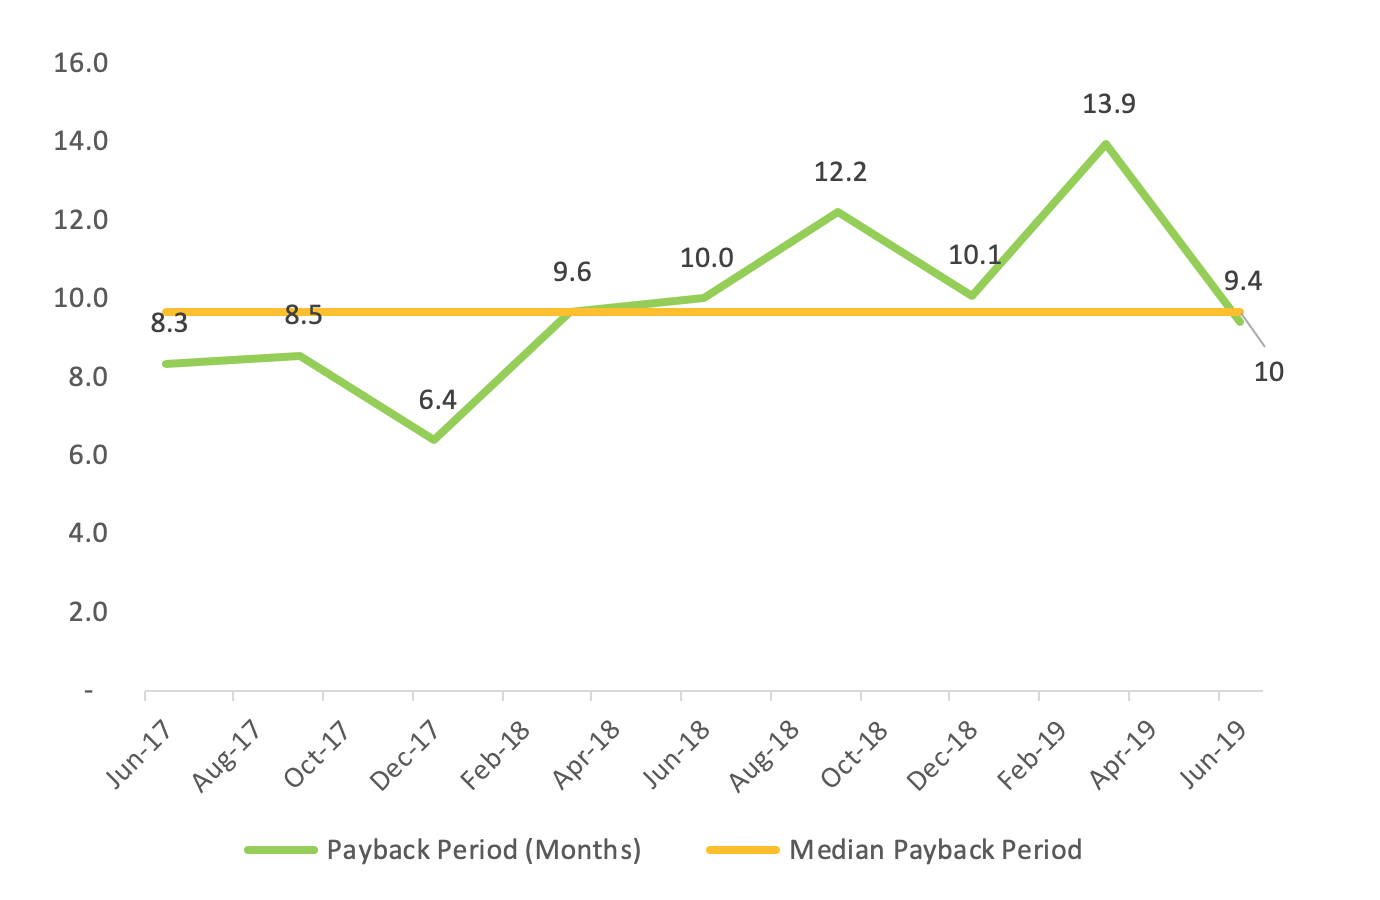
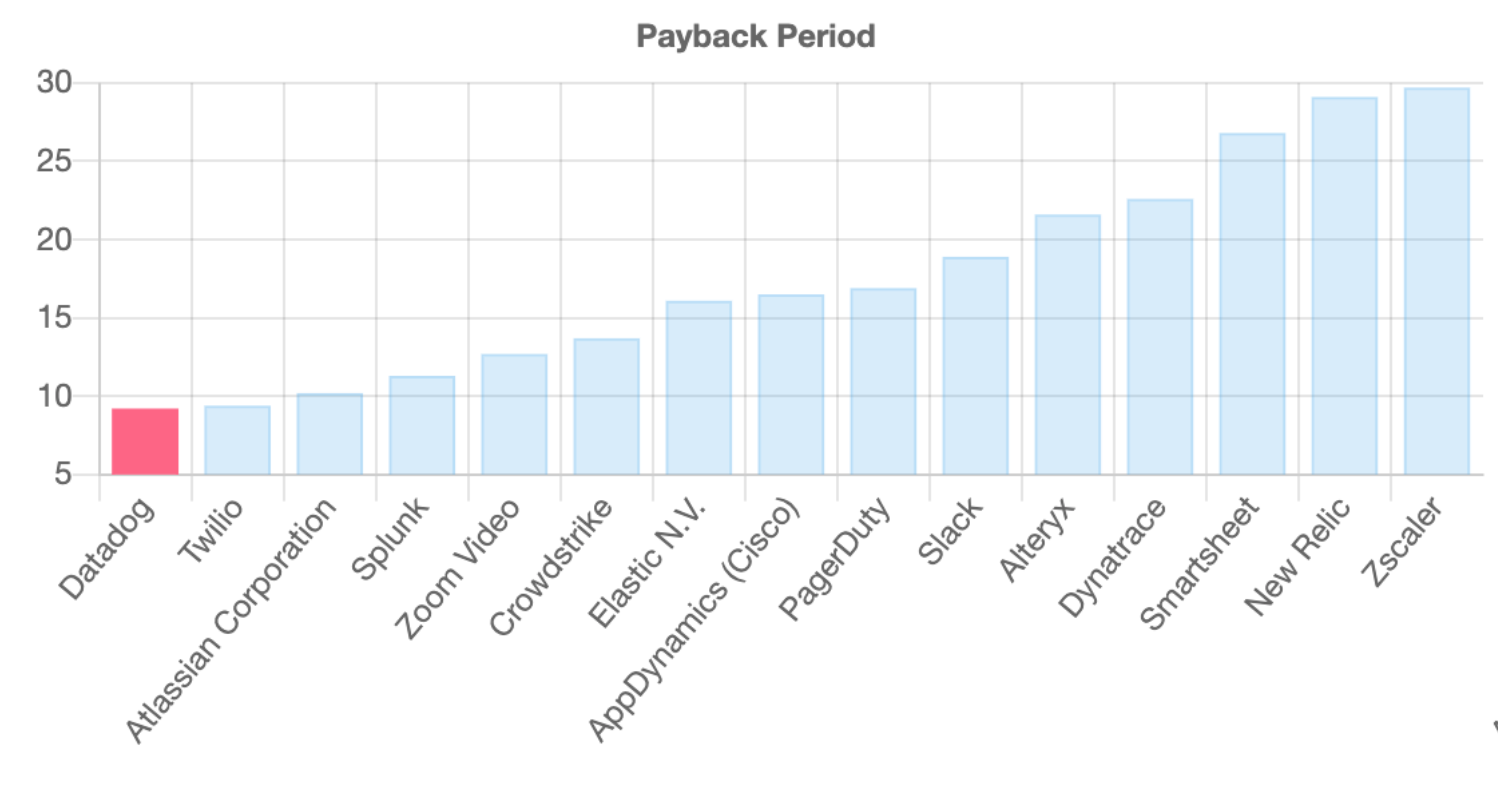
Payback Period: Datadog has the lowest payback period (9 months) driven by the self-service model and high-velocity sales motion. And the most recent payback period wasn’t just an anomaly: if you take the median payback period in the last 8 quarters, it’s roughly 10 months.
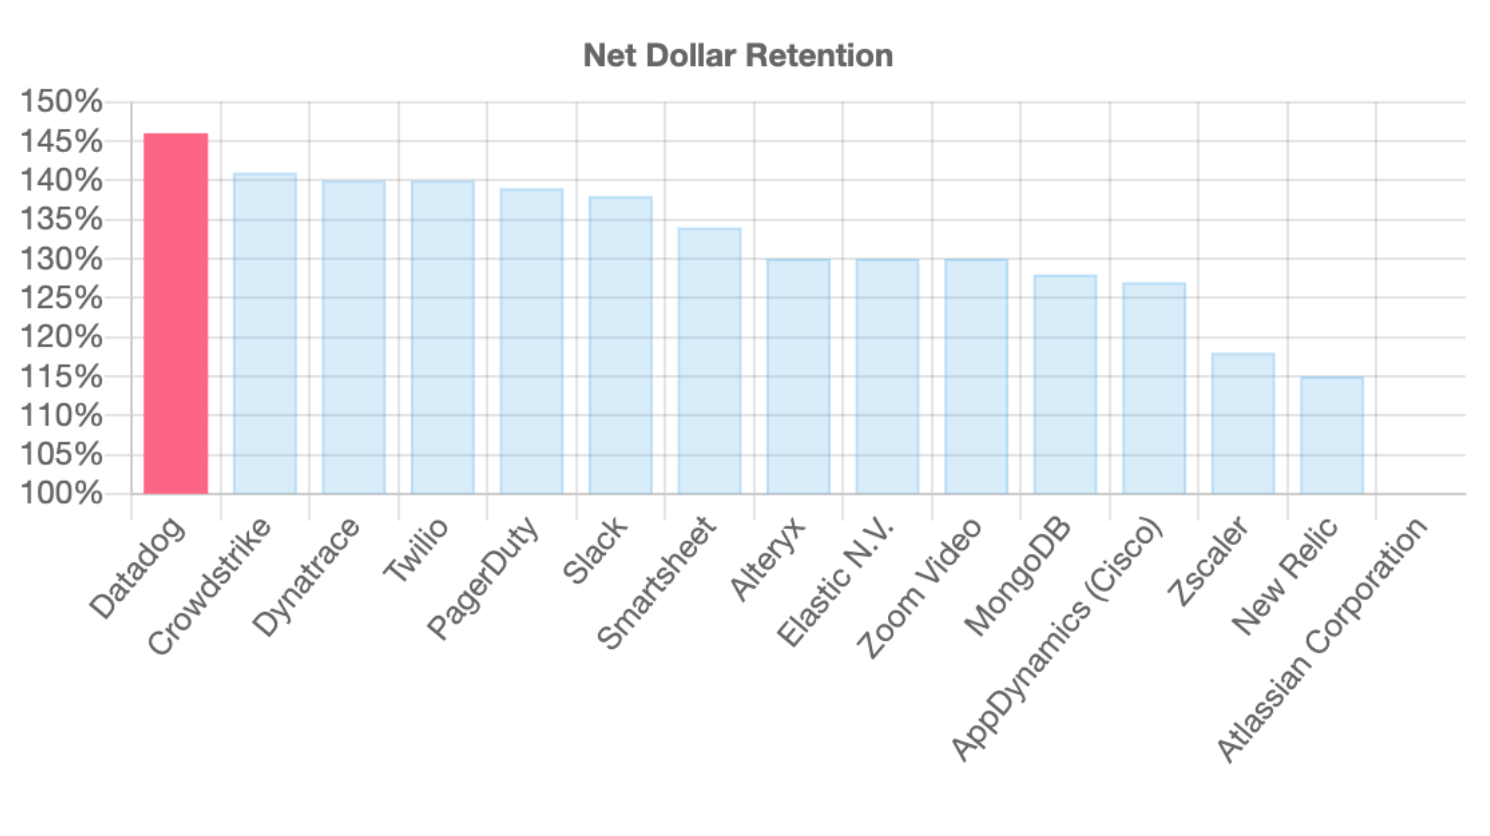
Retention: Datadog’s 146% net dollar retention is highest among public SaaS. Customers almost never churn (90–95% gross dollar retention according to their filing) and customers pay more when adding more workloads as customers migrate or add more applications to the cloud. Additionally, because Datadog continues to release new product lines, Datadog can upsell existing customers other products like their APM or Log Management product. That’s highlighted by 40% of their customers paying for more than one product (as of June 30th, 2019) up from 10% a year prior.
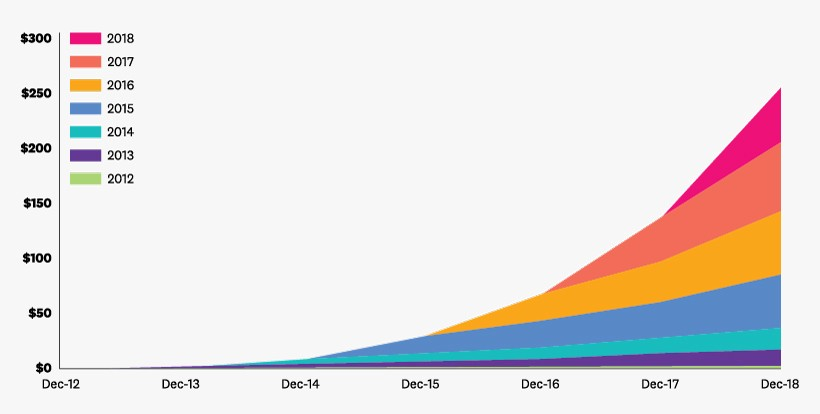
It’s impressive how much Datadog’s cohorts expand even beyond year 1. From their S-1: “For example, the 2014 cohort includes all customers as of the end of 2014. This cohort increased their ARR from $4.8 million as of December 31, 2014 to $19.2 million as of December 31, 2018, representing a multiple of 4.0x.”
Capital Efficiency: Datadog spent $30m of cash to get to $330m ARR. That’s ridiculous capital efficiency ($1 spent for every $10 ARR). In comparison, Slack spent nearly ~$560m in capital to get to $539m ARR which is good and roughly $1 spent for every $1 ARR. Datadog is almost 10x more capital efficient than Slack is!
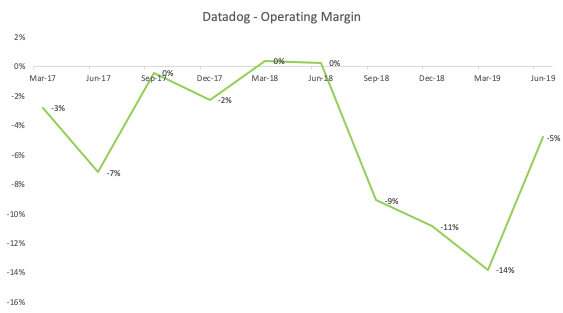
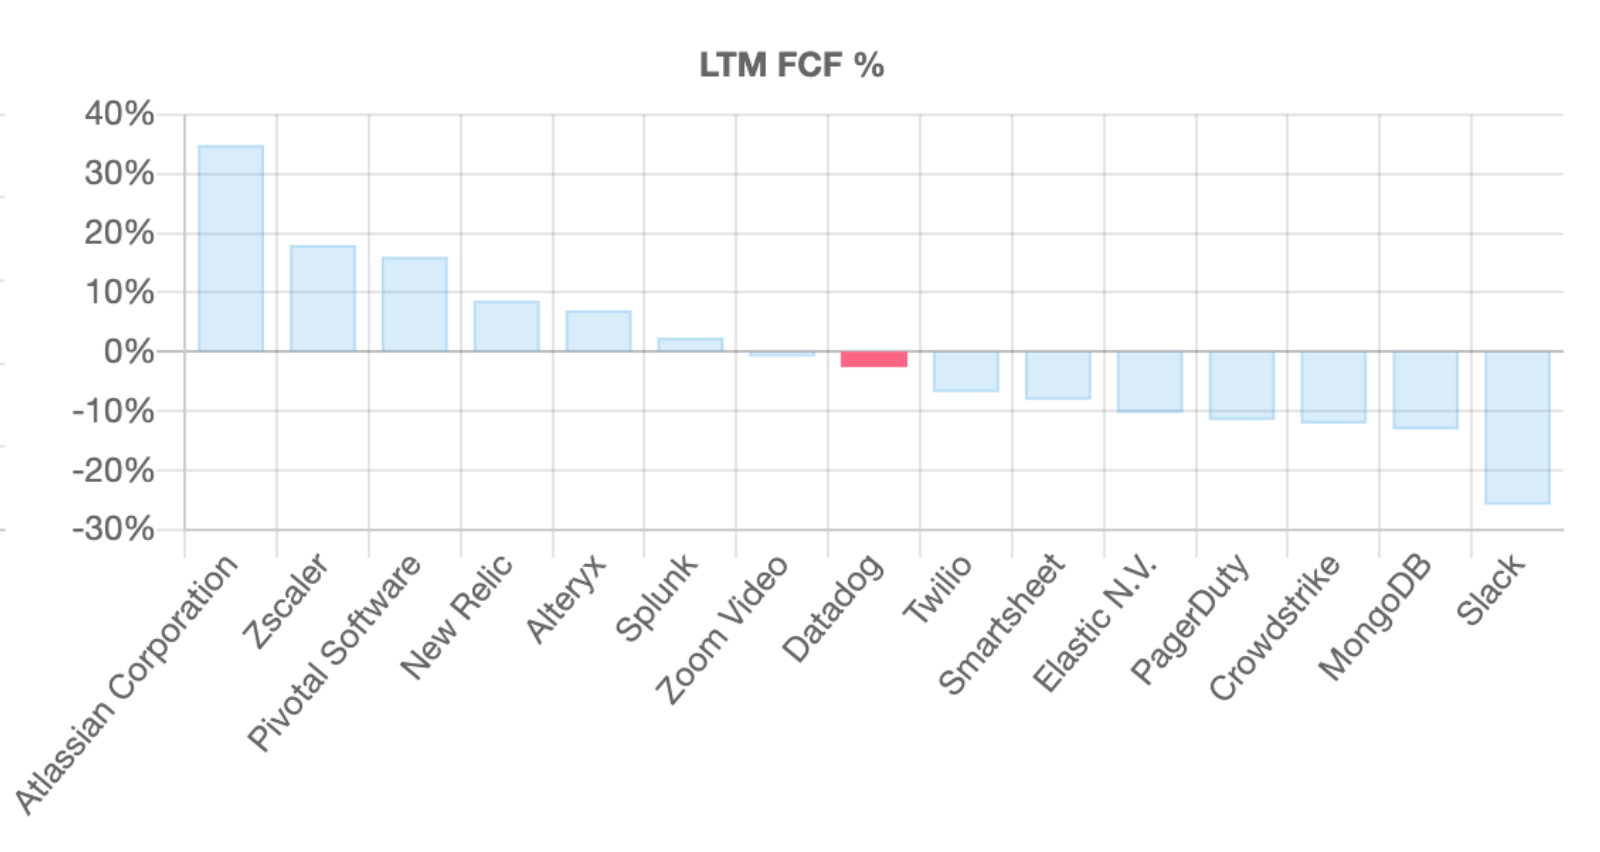
While Datadog is still not yet profitable (-5% operating income margins in most recent quarter June 30th, 2019), Datadog is effectively cash flow break-even at ~-4% free cash flow margins and even generated $6m of free cash flow in CY2017.
Other Interesting Business Metrics
Average Annual Contract Values (ACVs): With 8,846 customers as of June 30, 2019 (up from 7,676 in December 2018) and a ARR of ~$330m, average ACVs per customer is roughly ~$37,000.
Customers of >$100,000 and $1M+ ARR: Datadog’s growth is coming from customers paying >$100,000 ARR and even $1M+ ARR and its revenue is increasingly driven by these larger customers.
- “594, 453, 239 and 126 of our customers had ARR of $100,000 or more as of June 30, 2019 and December 31, 2018, 2017 and 2016, respectively, accounting for approximately 72%, 68%, 60% and 48% of our ARR”
- As of June 30, 2019, we had 42 customers with ARR of $1.0 million or more, up from 29, 12 and two customers as of December 31, 2018, 2017 and 2016, respectively
International Revenue: 24% of ARR is from customers outside of North America. International markets seems like a growth opportunity for Datadog.
Market Opportunity
Large and Growing Market: Company estimates its market size is $35b based on average contract values and number of customers in its given market. Datadog cites an IDC research that infrastructure and platform-as-a-service spend will nearly triple from $60b in 2018 to $173b in 2022. It doesn’t take a huge leap of faith to believe that companies will continue to spend on migrating from on-premise legacy systems to the cloud and will require adopting monitoring solutions like Datadog and its competitors.
Competitors
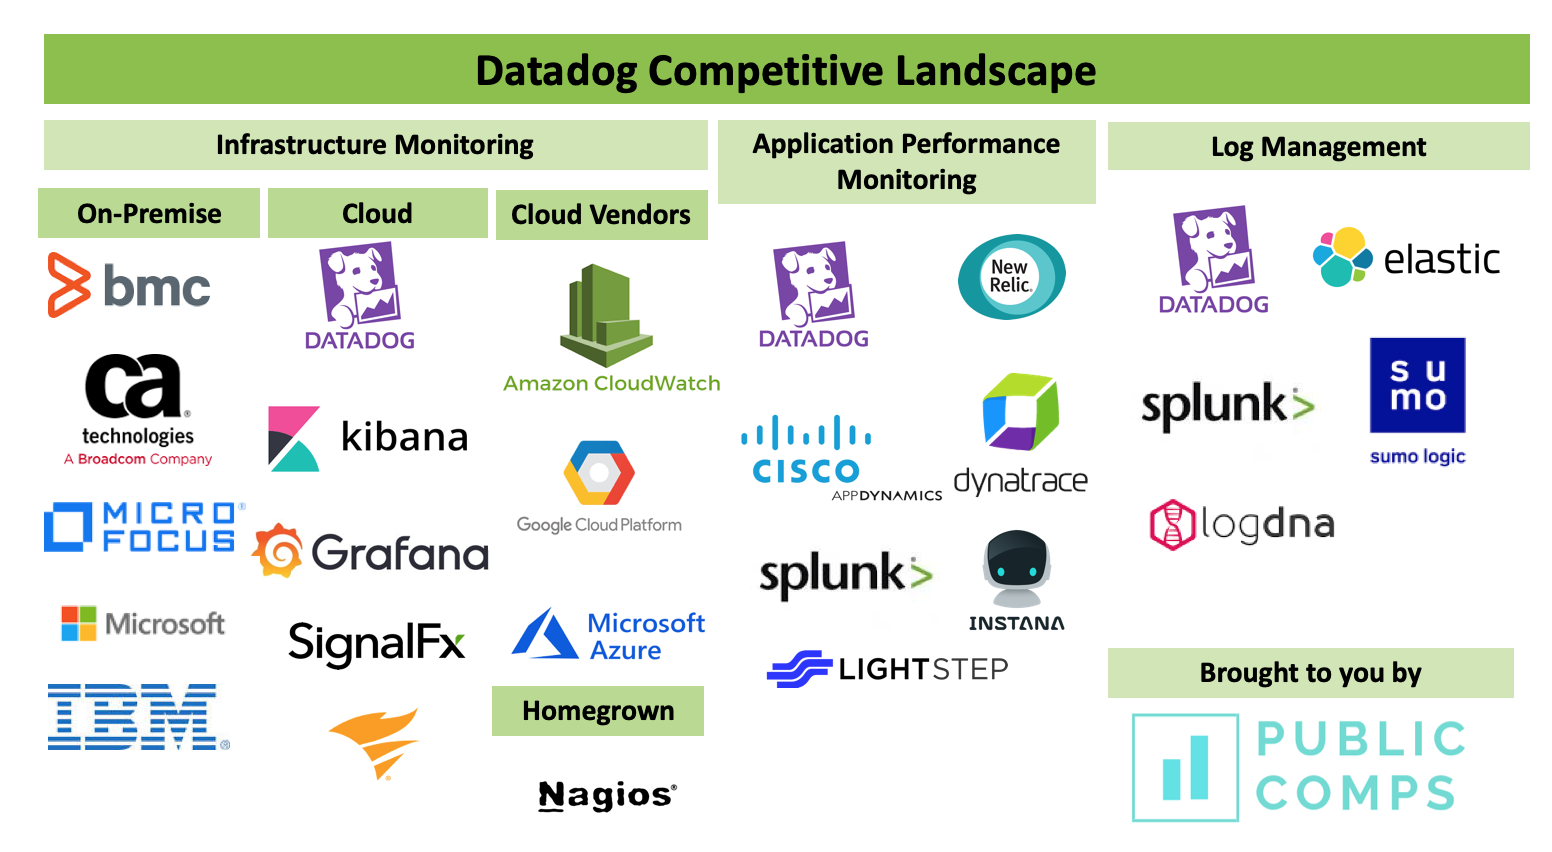
Infrastructure Monitoring:
Datadog claims it competes against on-premise infrastructure monitoring tools that don’t work quite well in a world of distributed systems and micro-services like CA Technologies, BMC, Microfocus, Microsoft and IBM.
Company also competes with homegrown solutions that leverage open source solutions like Graphite and Nagios but the downside of these solutions are that engineers are required to integrate with data sources and other vendors and aren’t built for DevOps colloboration.
Other cloud-focused monitoring competitors include Kibana (Elastic), Grafana (open source), and SignalFx (acquired by Splunk for ~$1b). Grafana, in particular, is quite interesting since its an open-source alternative to Datadog (you fork their repo here and start visualizing logs and metrics) and the visualizations are stunning. Because Grafana is open source, it’s free and I suspect a phenomenal GTM for Grafana as it acts as a “free trial”. Grafana does have an enterprise product that has “premium plugins” and “enterprise security” features like locking down sensitive data and clearly states what goes into open source and enterprise product. The business just raised its $24m Series A from Lightspeed. My guess is Grafana is the biggest threat to Datadog moving forward since its a “free” open-source alternative to Datadog — one of the biggest complaint about Datadog is that it’s too expensive (see this Reddit thread and this Runnable article).
Datadog also competes with the cloud vendor’s own solutions like AWS Cloud Watch and GCP and Azure’s cloud infrastructure monitoring solutions.
Application Performance Monitoring:
It’s interesting to note that Datadog just got into the Application Performance Monitoring space in 2017 (~2 years ago) and the number of public SaaS competitors.
Competitors include Appdynamics (Cisco acquired in early 2017), New Relic (NYSE: NEWR), Dynatrace (NYSE: DT), Solarwinds (NYSE:SWI), and Splunk’s own APM product.
Start up competitors include Lightstep ($70m raised, Microservices and Serverless APM and Observability) and Instana ($57m raised, APM for microservices)
Log Management: Splunk’s recent acquisition of SignalFx puts Splunk directly competitive with Datadog across all three product verticals. It’s interesting that both are ~$300m ARR growing 80% YoY. Other competitors in the log management market include Elastic (NYSE: ESTC), Splunk, Sumo Logic, and LogDNA.
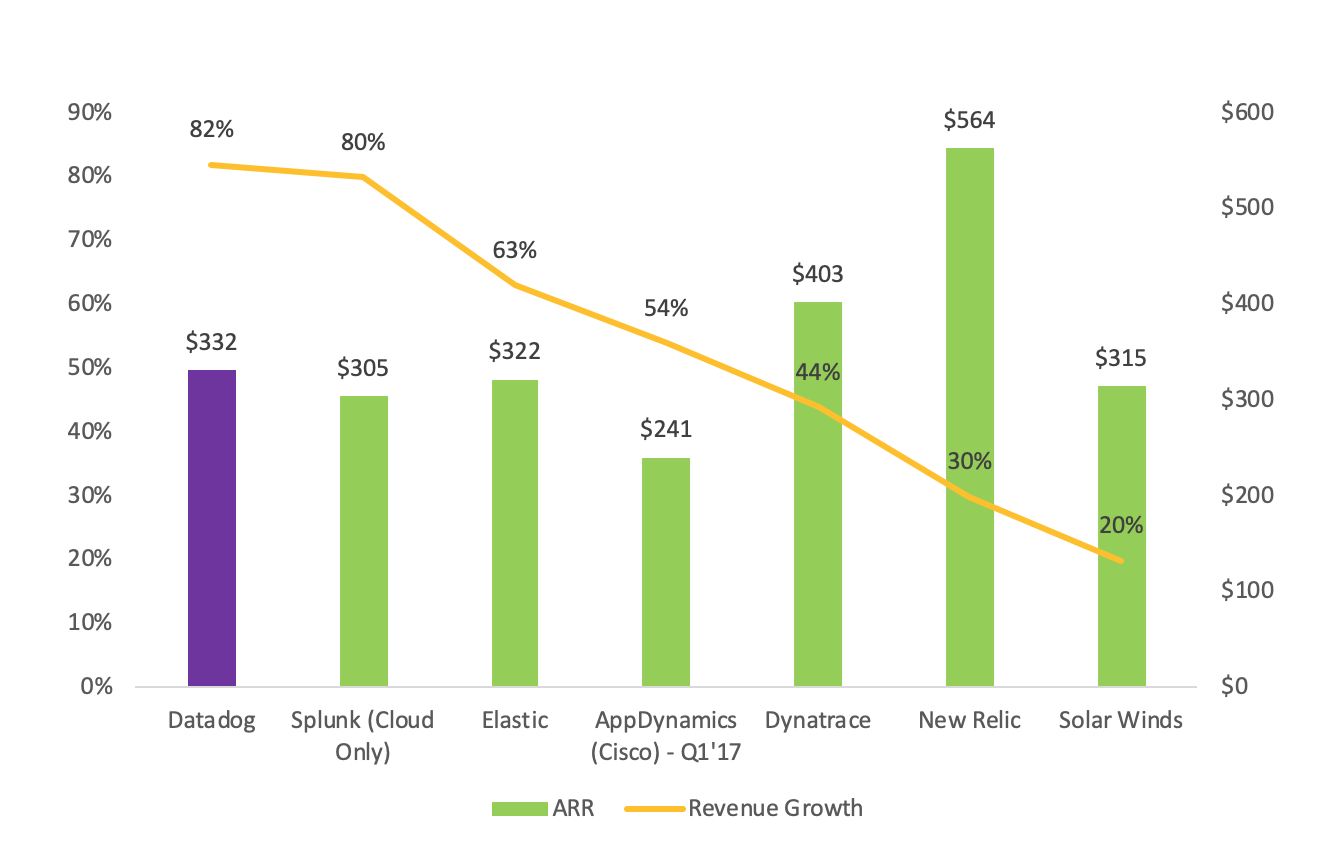
It’s worth noting that Datadog is growing more quickly than most of its public market SaaS competitors particularly Elastic, Appdynamics (acquired by Cisco), Dynatrace, Splunk, New Relic and Solar Winds.
Valuation
Since Datadog is a fast growth SaaS company, it’ll likely get valued on a Next-Twelve-Month ARR multiple.
The fastest growing SaaS companies (90%+ YoY) like Zoom, Crowdstrike trade for 20–25x+ NTM ARR and other fast growth companies (40–80% YoY growth) like Zscaler, Alteryx, Twilio, Slack, MongoDB trade between 13–18x NTM ARR.
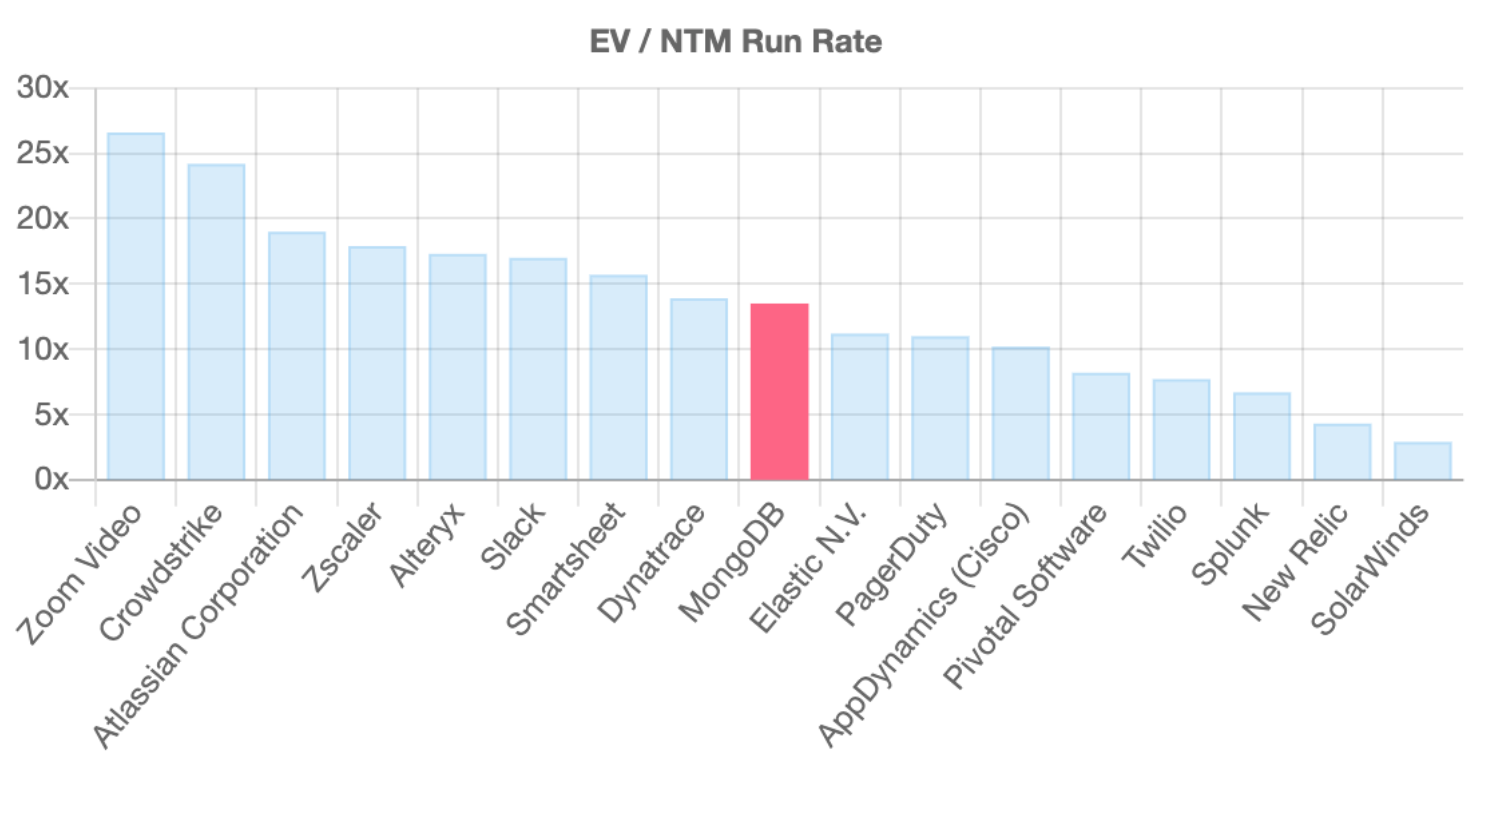
Using 13–18x NTM ARR as a rough ball park and assuming Datadog grows 85% (see growth persistence) of its currently growth rate of 82% so roughly ~70% YoY, Datadog should be~$560m ARR 12 months from now which implies $7.28b — $10b enterprise value.
The >5% institutional shareholders are Index Ventures (20%), Openview (16%), ICONIQ (11.3%), and RTP (8.2%). Olivier (Co-founder/CEO) owns 14.1% and Alexis (Co-founder/CTO) owns 8.9%.
Conclusion
Datadog is riding the wave of companies moving towards the cloud and is spearheading the best practices of Developers and Technical Operations teams (DevOps) working together within Datadog’s platform. The business continues to grow rapidly with best-in-class sales efficiency and retention. We believe Datadog will have a very successful IPO and are excited to see where the business goes. Congratulations to Olivier, Alexis and the Datadog team!
Caveats:
- I am not a financial advisor and I’m also not an investor in Datadog. This post is not meant to be investment advice.
- I borrow some of the same graphs that Alex Clayton uses in his S-1 breakdowns because they’re smart and important.