Public Comps Weekly Dashboard 9/4/2020: Time series and ZM Q2 Earnings Teardown
We break down ZM's Q2FY21 Earnings

👋 Public Comps Customers 👋
What a crazy week, valuations soared to new heights following Zoom's incredible quarter was reported after hours on Monday, but proceeded to fall in the latter half of the week. This newsletter highlights a new feature: our time series analysis, and breaks down Zoom's Q2 earnings.
On Friday, I published my take on Crowdstrike's Q2 earnings teardown!
1️⃣ SaaS Stock Prices vs. Benchmarks 📊
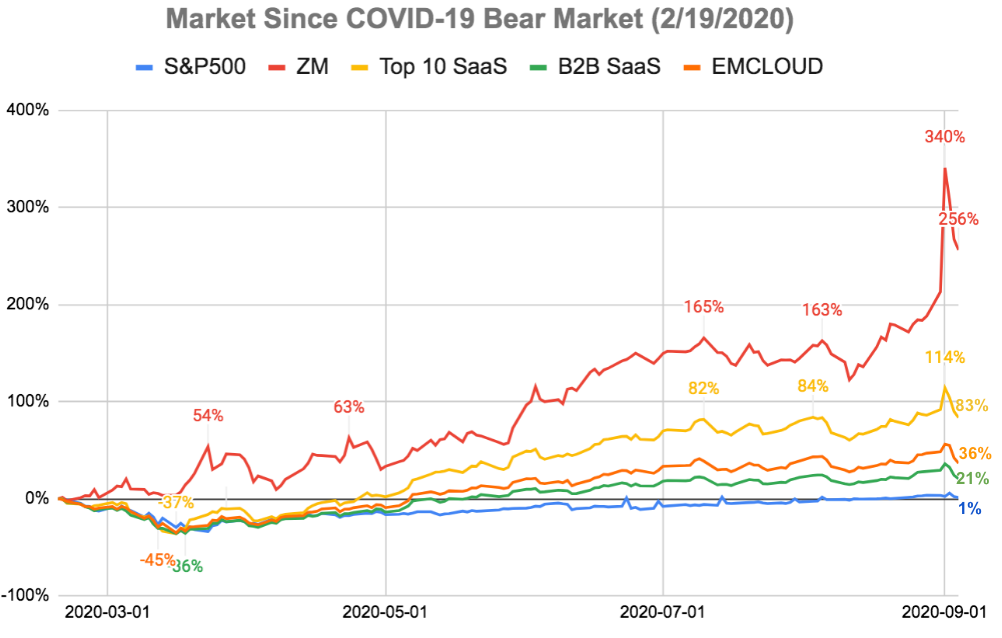
Change since bear market start (2/19/2020):
- ZM: +256%
- Top 10 SaaS: +83.4%
- Bessemer Cloud Index (EMCLOUD): +36.5%
- B2B SaaS: +20.5%
- S&P 500: +1.2%
Change in the past week:
- ZM: +23.6%
- Top 10 SaaS: -1.3%
- Bessemer Cloud Index (EMCLOUD): -7%
- B2B SaaS: -5.9%
- S&P 500: -2.3%
Market update📉: valuations climbed early in the week, driven by some of the tech names that have propelled the recovery from the late-March lows. Apple continued to attract investor demand after its 4:1 stock split, and Zoom surged after its incredible earnings report. Zoom's accelerated growth helped drive sentiment on other tech names and expectations were extremely high. Despite great earnings reports from Crowdstrike, Smartsheet, Docusign, the latter half of the week saw a sector wide decline, especially in higher growth names.
2️⃣ Product Update: Time series 🙌
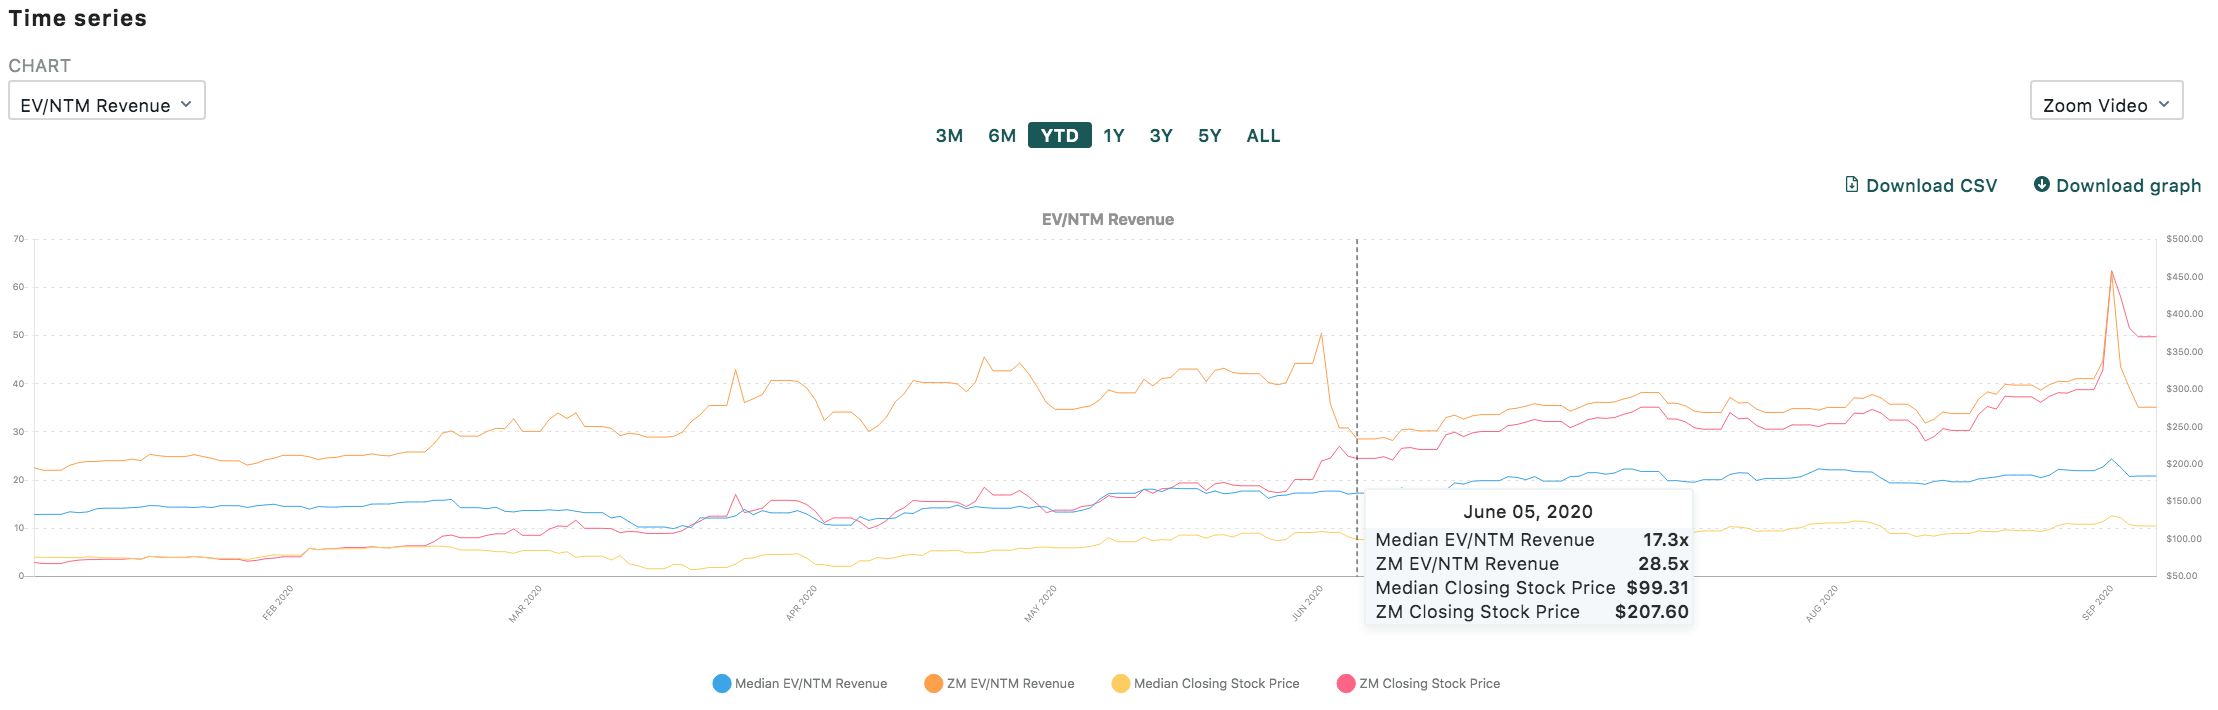
We've added a dashboard feature: Time series! Time series allows users to benchmark individual stock prices and their valuation multiple (NTM, LTM, Run rate, NTM gross profit run-rate, etc.) against the median valuation multiple of a given cohort. On any given day, users can get data on the price and valuation multiple at that point in time.
Here, I'm showing Zoom's stock price and EV/NTM multiple benchmarked against a subset of high growth SaaS names.
3️⃣ SaaS Earnings - Zoom ($ZM) 💸
Press Release | Earnings Call Transcript | Earnings Presentation Slides
$ZM had a MONSTER quarter🔥:
— Public Comps (@publiccomps) August 31, 2020
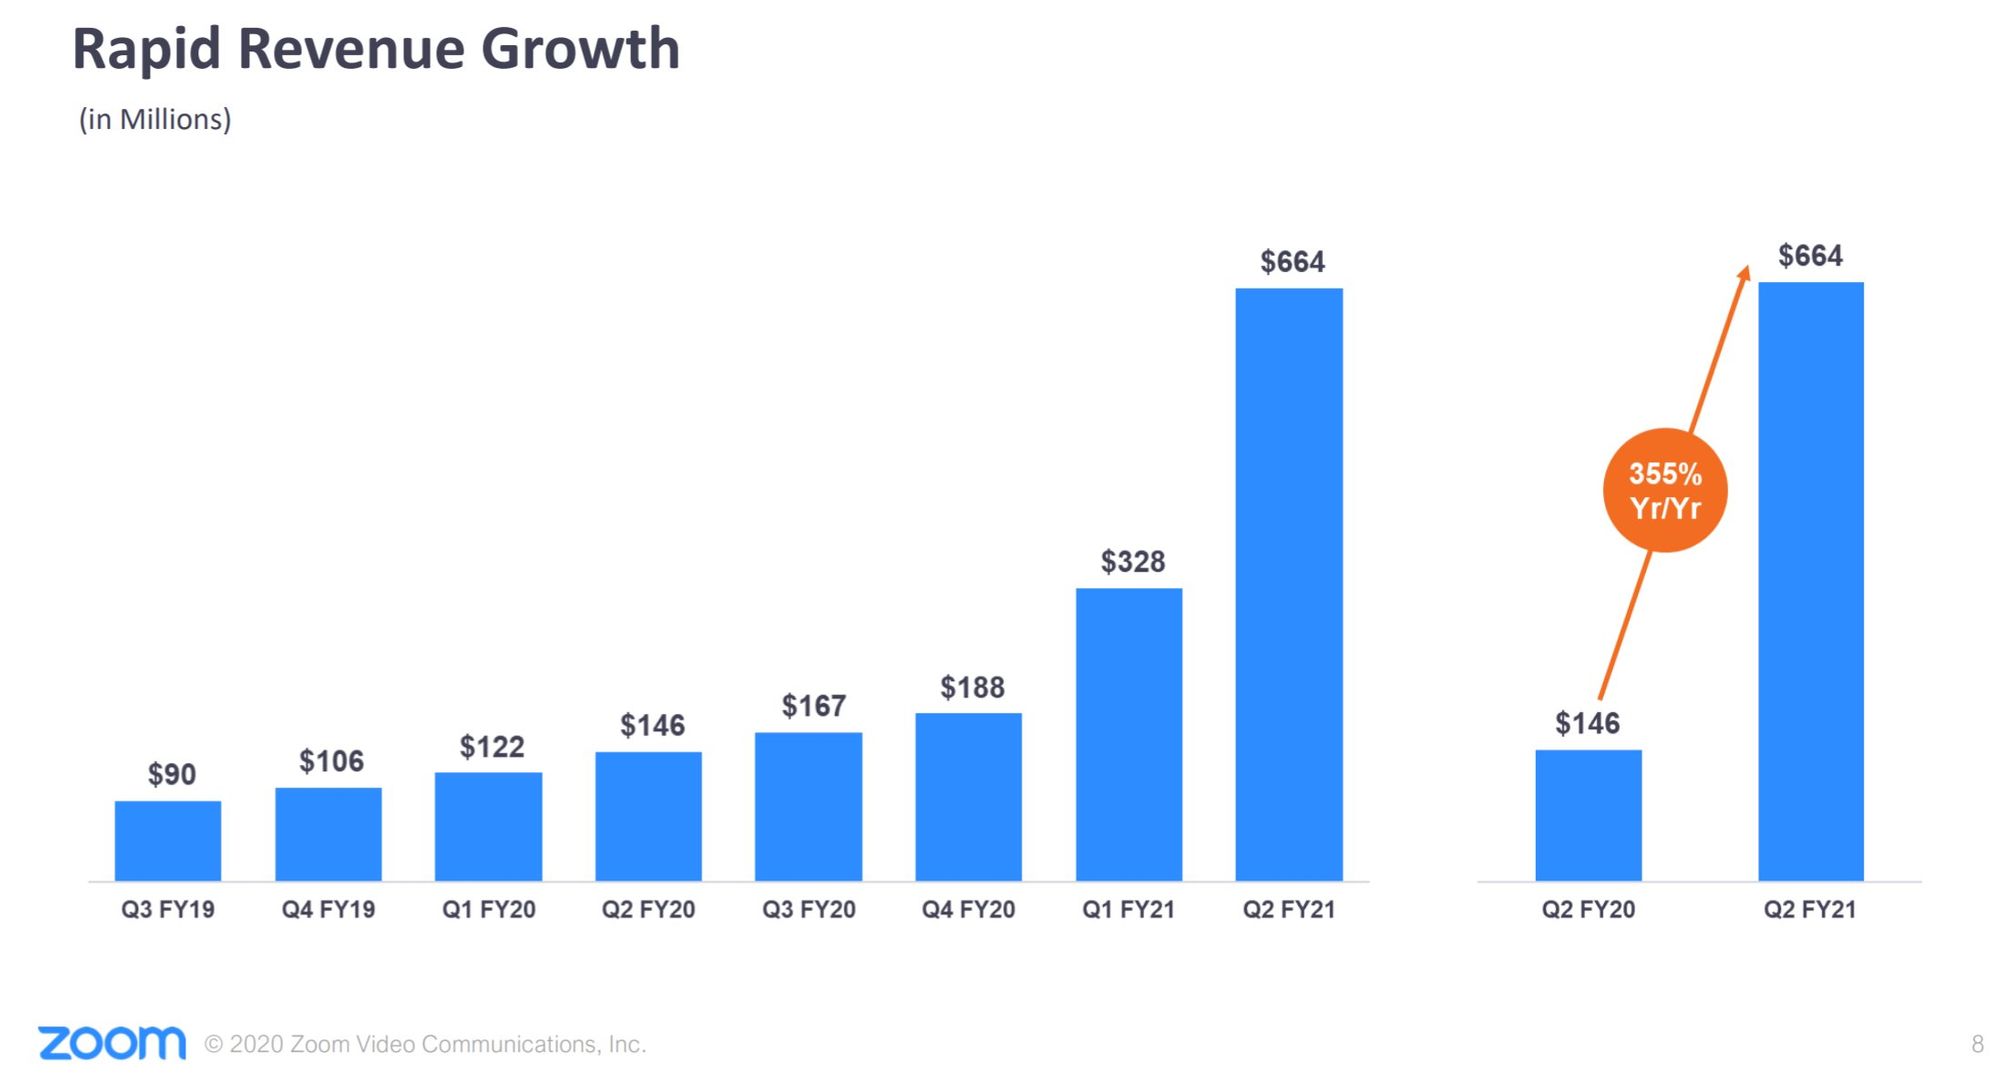
📈Revenue: $663.5M +355% yoy
🚀Customers with >100k ACV +112% yoy
370.2k customers with >10 employees +458% yoy
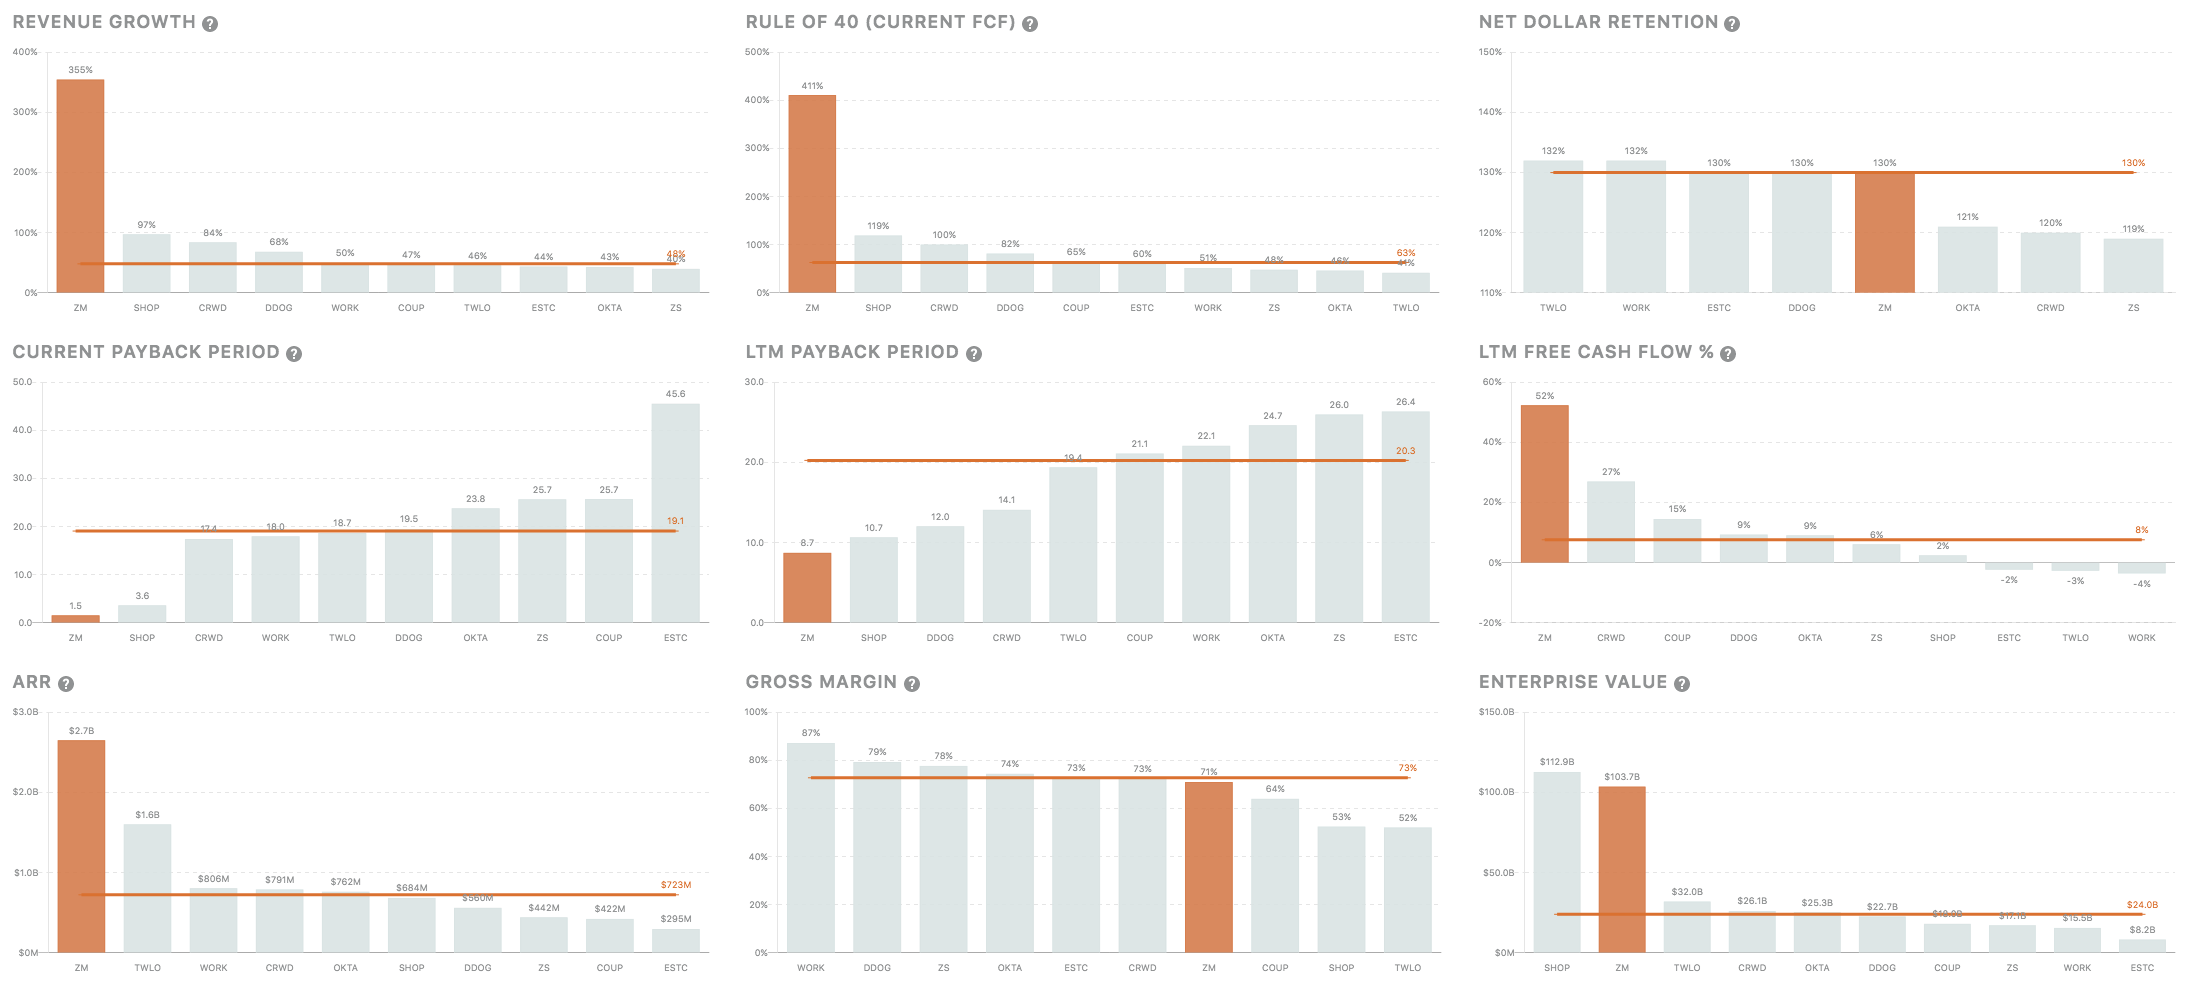
💯Net dollar retention: >130%
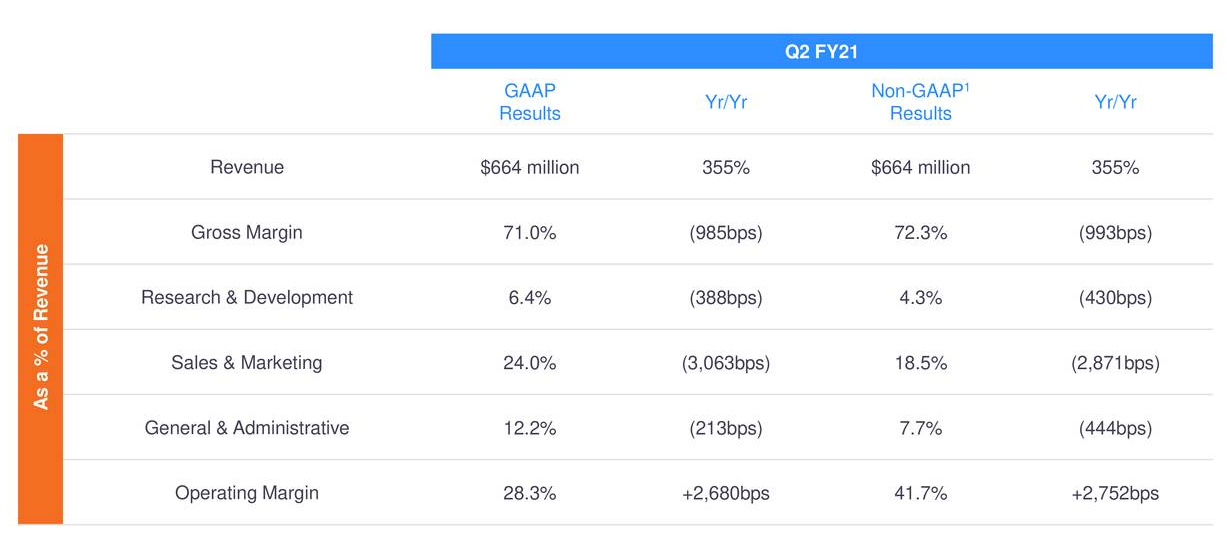
🙌non-GAAP income: $277M (margin 41.7%)
💵Cash & equiv: $1.5B
😮FY revenue guidance of $2.38B
Unreal‼️
Highlights:
- Revenue: grew 355% to $664M on lower-than-expected churn and exceptional sales execution. ZM added 336M of ARR in the quarter. For the quarter, the year-over-year growth in revenue was primarily due to subscription provided to new customers, which accounted for approximately 81% of the increase, while subscriptions provided to existing customers accounted for approximately 19% of the increase.
- Remaining performance obligation (RPO): 1.4B in RPO (+209% yoy), deferred revenue grew to 743M (+309% yoy). Management expects to recognize ~72% ($1B) of the total RPO as revenue over the next 12 months, compared to 62% ($285M) in Q2FY20. This indicates a shift in their renewal seasonality, which was historically weighted toward Q2 and Q4 and has now shifted to Q1 due to the strength of last quarter's performance.
- Customers: net customer adds accelerated – ended Q2 with 304k customers with more than 10 employees (+458% yoy). These customers represented 36% of total revenue, up from 30% in Q1 and 20% in Q4. ZM ended the quarter with 988 enterprise customers generating more than $100k in TTM revenue (+112% yoy), an increase of 219 net adds over Q1.
- International growth: accelerated to 629% yoy and represented 31% of revenue. Americas great by 288% yoy.
- Gross margins: improved by 3% (69% -> 72%) from Q1 reflecting their strategy to increase co-located data center capacity with public cloud. Management expects gross margins for the rest of the year to be in consistent with Q2.
- Zoom Phone: In mid-June, Zoom Phone was authorized under the FedRAMP program, enabling federal agencies to consolidate their costly, legacy telephonic systems onto our unified modern cloud solutions. This month, we expanded the availability of Zoom Phone service to 25 additional countries and territories.
- Product launches: Zoom Hardware as a Service with subscription options for phone and meeting room hardware. Also launched Zoom for Home to support remote work.
- Cash flow & margins: Operating Cash flow of 401.3M in Q2 (+1188% yoy) and free cash flow of 373.4M (+2079% yoy). The increase is attributable to strong collections from the large increase in top-line growth and higher percentage of monthly contracts throughout the quarter. For the second half of the fiscal year, ZM expects to increase capital expenditures for additional data center infrastructure. ZM also expects operating margins to decrease from the peak in Q2 over the balance of this year. Its prudent to expect margins to normalize to lower levels over the next several quarters.
As always, feel free to shoot me an email if you have any questions, feedback, or concerns.
Stay safe everyone,
Albert Wang, Public Comps Team
albert@publiccomps.com
Like these weekly dashboards? These are for Publiccomps.com customers only but you can have your friends subscribe to the newsletter here where we send out investment memos, market maps and analysis on the broader SaaS market.
Views expressed in theses emails are ours and ours alone and don't represent that of our previous or current employers. Public Comps provides financial and industry information regarding public software companies as part of our weekly dashboard, our blog, and emails. Such information is for general informational purposes only and should not be construed as investment advice or other professional advice.
Full disclosure: I own CRWD, TWLO, SHOP, LVGO, FB, MSFT, DDOG, ESTC, AYX, SMAR, PLAN, and ZM.