Public Comps: Contextualizing SaaS Markets
SaaS multiples have contracted 32% as quantitative tightening accelerates. We contextualize it in this piece.


As SaaS equities continue to experience a seemingly never-ending correction, we look to contextualize the markets in an increasingly volatile macroeconomic climate. In this brief piece, we cover:
- Corrections to SaaS markets by the numbers
- Key macroeconomic drivers behind major investor sell-offs
- A fork in the road: where do we go from here?
SaaS By the Numbers
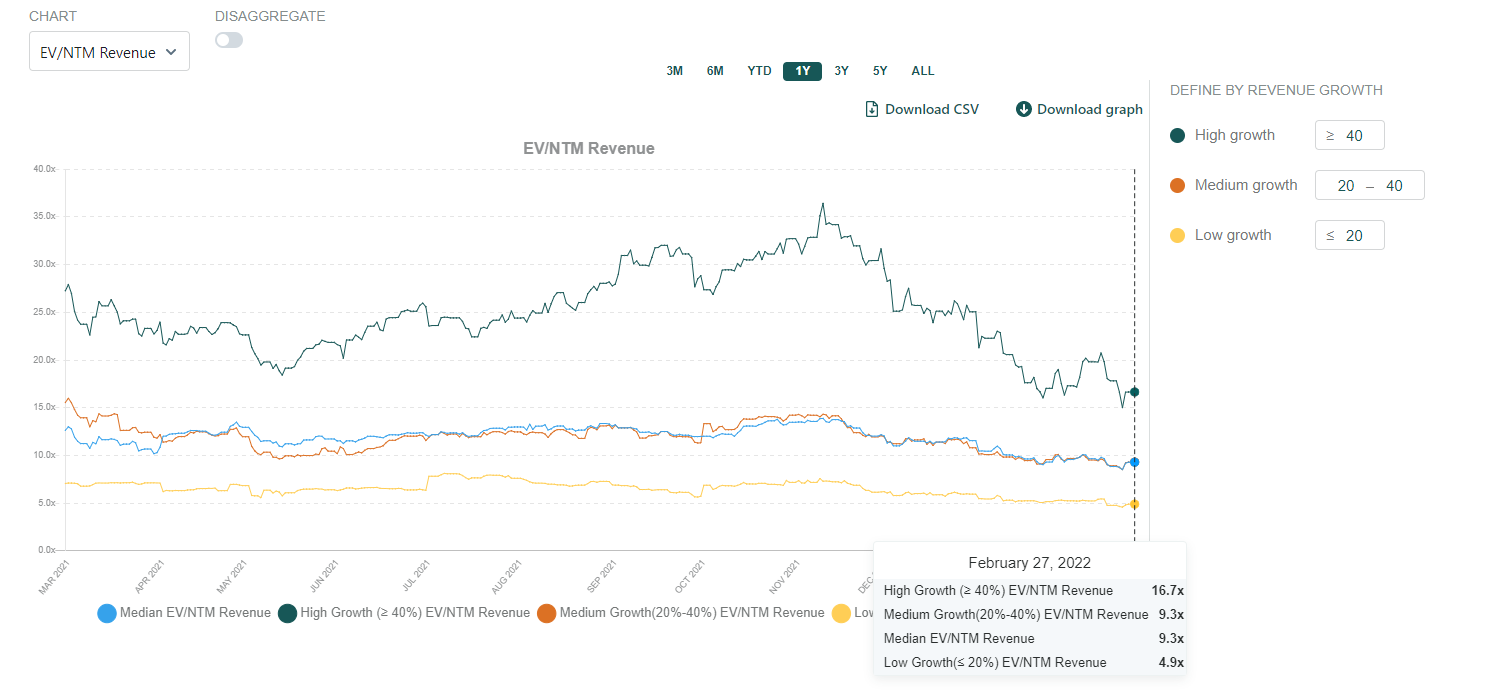
B2B SaaS EV/NTM Revenue Valuation Multiples (as of 2/27):
- High growth SaaS: 16.7x
- Medium growth SaaS: 9.3x
- Median growth SaaS: 9.3x
- Low growth SaaS: 4.9x
B2B SaaS Pricing
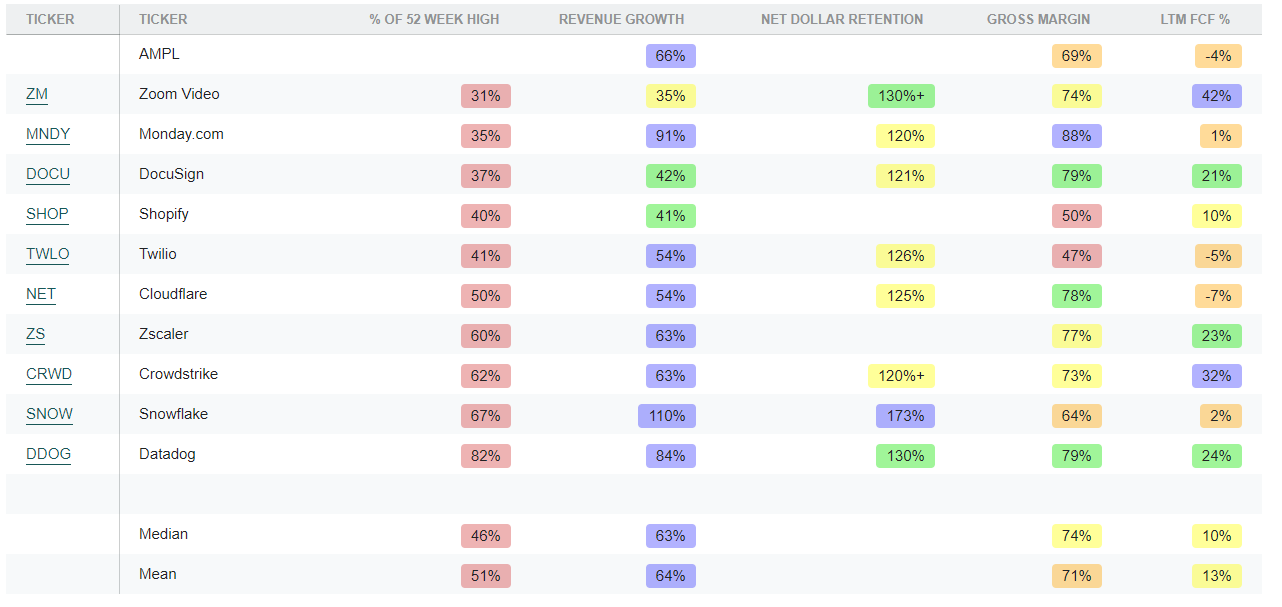
- Median B2B SaaS % of 52-week high: 63%
- Multiple compression from peak to trough LTM: -32%
- Multiple compression from peak to trough over the past three months: -24%
To put more color behind losses: out of the 122 company pricing data we track, more than 68% of them closed at 70% or lower of their 52-week highs. Additionally, a substantial 29% of B2B SaaS businesses traded at half their 52-week highs...
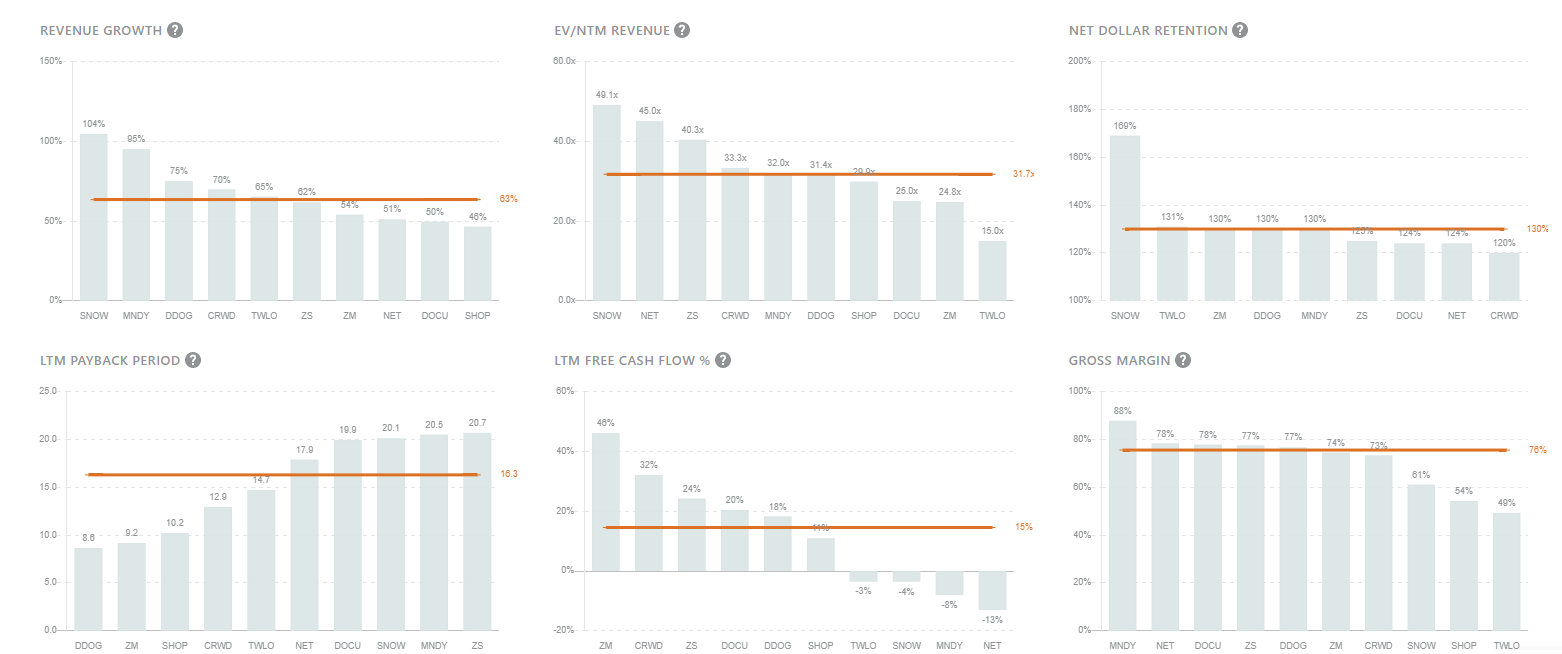
However, the highest quality B2B SaaS businesses are still trading at strong 31.7x forward revenue multiples as investors recognize the value in >30% revenue growth YoY despite substantial multiple contraction. Although the standard is no longer >30x NTM revenue for virtually every SaaS business growing their top-line >30% YoY, best-in-class SaaS companies continue to rate at high premiums.
Macro drivers behind growth sell-offs
High growth SaaS multiples have contracted from their peak in early November by over 54%. Since the last major correction we covered in our 2021 year-in-review, multiples across the board have only further fallen as key macroeconomic indicators point to tightening liquidity:
- U.S. 10-Year Treasury is climbing back to pre-COVID levels at 1.91% compared to the trough seen at 1.17% over the past year
- Impending "quantitative tightening" which puts a lid on liquidity pouring into equities
- Almost all high-growth software portfolios have had substantial losses with the NASDAQ down >13% since 2022 has begun
Although the growth sell-offs are driven largely by the implications of a tightening macroeconomic climate, it's clear that bearish investor sentiment and growing fears among retail and institutional investors is playing a tremendous role in valuation. While it's true the rise of risk-free rates and increased market volatility increases the theoretical cost of equity, and depresses much of the Street's view of intrinsic valuation, there are clearly other factors at play. Average prices trading at 63% of 52-week high prices not only price in expected macroeconomic volatility, but also an irrational fear of price action as bears believe we are far from the bottom.
A Fork in the Road: Bulls vs Bears
The result of the countermeasures taken against the pandemic has now pit investors at a fork in the road.
- Bull view: Best-in-class SaaS businesses are trading at rational valuations and the market is undermining long-term free cash flows. Current price action is non-fundamental as SaaS companies continue to execute consistent 30%+ YoY revenue growth.
- Bear view: Future rate hikes and quantitative tightening is not over. Volatility from macro factors are yet to be fully priced in, which means more attractive entry points can be expected. Multiple expansion is a result of irrational exuberance and multiples will eventually compress to pre-COVID levels.
The bull view on SaaS: A substantial part of the correction this time around is in fact driven by non-fundamental investor sentiment. From an executional standpoint, many of the best-in-class SaaS names have not deviated significantly from consensus. It's clear that the digital transformation experienced during the pandemic is still in its early innings, and virtually all spending on enterprise software will be in the cloud.
Non-negligible value in B2B SaaS is lost to non-execution related factors: The unique gem of the enterprise B2B SaaS model lies within the unit economics (LTV/CAC), which mitigates execution risk during bear markets relative to other models. Although it's fair to argue that B2C software/fintech businesses are adversely affected by rising interest rates due to higher CACs, the deferred revenues and payback periods in B2B mitigate this inefficiency. Additionally, highly recurring revenue streams due to the mission-criticality of many SaaS names alleviate concerns around retention and create attractive opportunity for upsell revenue (LTV).
Concerns of multiple compression: It's expected a large part of the sell-offs are motivated by real concerns of multiple compression as SaaS multiples only continue to de-rate. However, many investors underestimate the value hidden within growth. It's important to remember that the thesis of owning strong SaaS businesses that are able to execute and sustain growth is rooted in the balance between multiple expansion/compression and growth. From back-of-the-envelope math, all else equal, an investor holding a business growing 30% YoY over a five-year period:
- Yields nearly a 3x return assuming no multiple contraction/expansion
- Suffers a loss only if the multiple contracts by over 73%
The bull view isn't to say that every SaaS business will be a winner. Rather, it's the quality names with consistently high revenue growth and line of sight to profitability – which is a function of management, product, market dynamics, among others – that will be the ones to generate risk-adjusted value for long-term shareholders at reasonable valuations.
That's it for this week. As always, never hesitate to shoot over a message (reply to this email) for any feedback or if you’d just like to chat!
Cheers,
Jimmy Zhou (@jimmynzhou on Twitter)
Like these teardowns? These are for Publiccomps.com customers only but you can have your friends subscribe to the newsletter here where we send out investment memos, market maps and analysis on the broader SaaS market.
Views expressed in these emails are ours and ours alone and don’t represent that of our previous or current employers. Public Comps provides financial and industry information regarding public software companies as part of our weekly dashboard, our blog, and emails. Such information is for general informational purposes only and should not be construed as investment advice or other professional advice.