Top 5 SaaS Metrics VCs Look At for Series A/B/C
The due diligence process can seem like a black box at times, especially for first-time founders. Here are the metrics that matter most.


For SaaS founders, it isn’t always clear what metrics VCs are looking for during a Series A/B/C fundraise beyond ARR and ARR growth. What happens behind the scenes after sending over a data room to an investor? How do you turn your customer transaction file from Salesforce into the key metrics they will be focused on? For example, given a customer transaction file, how are you supposed to calculate Net Dollar Retention from cohort analysis or the breakdown of ARR via growth accounting? The due diligence process can seem like a black box at times, especially for first-time founders.
Today we wanted to open source the methodologies for analyzing the top SaaS metrics to demystify the data diligence process for entrepreneurs.
In this post, we’re going to share
- What are the top 5 key SaaS metrics VCs typically look at
- Why the metrics are important for building an enduring business
- How to calculate the metrics
- Relevant benchmarks for SaaS Companies
- Examples from an imaginary SaaS company raising a Series B (with software margins of 80%)
Caveats:
- The post biases towards B2B SaaS companies. We'll do a comprehensive write up on consumer subscription companies, so stay tuned!
- We write from the lens of a growth/momentum software investor. There are always exceptions to what software investors look for at the different stages. For example, investors may consider the top metric for a particular bottoms-up SaaS company at the Series A or B to be user base + engagement (DAU/MAU) vs revenue momentum.
- SaaS metrics are really the manifestation of the team, product, and market coming together. Companies are more than numbers on a spreadsheet. We can’t emphasize enough that metrics are NOT everything and its really the team, product, and market that matter.
- That said, investors are fundamentally looking to understand if a company has built a product that customers love and can put said product in the hands of customers quickly, efficiently, and profitably. Valuable metrics are ways that investors can quantitatively measure whether these are happening at a given company.
Top 5 SaaS Questions and Metrics
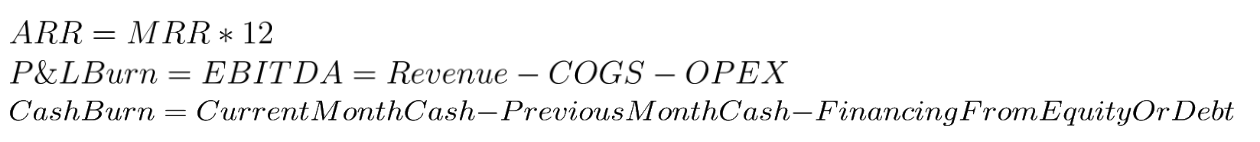
- Does the company have Product/Market Fit?
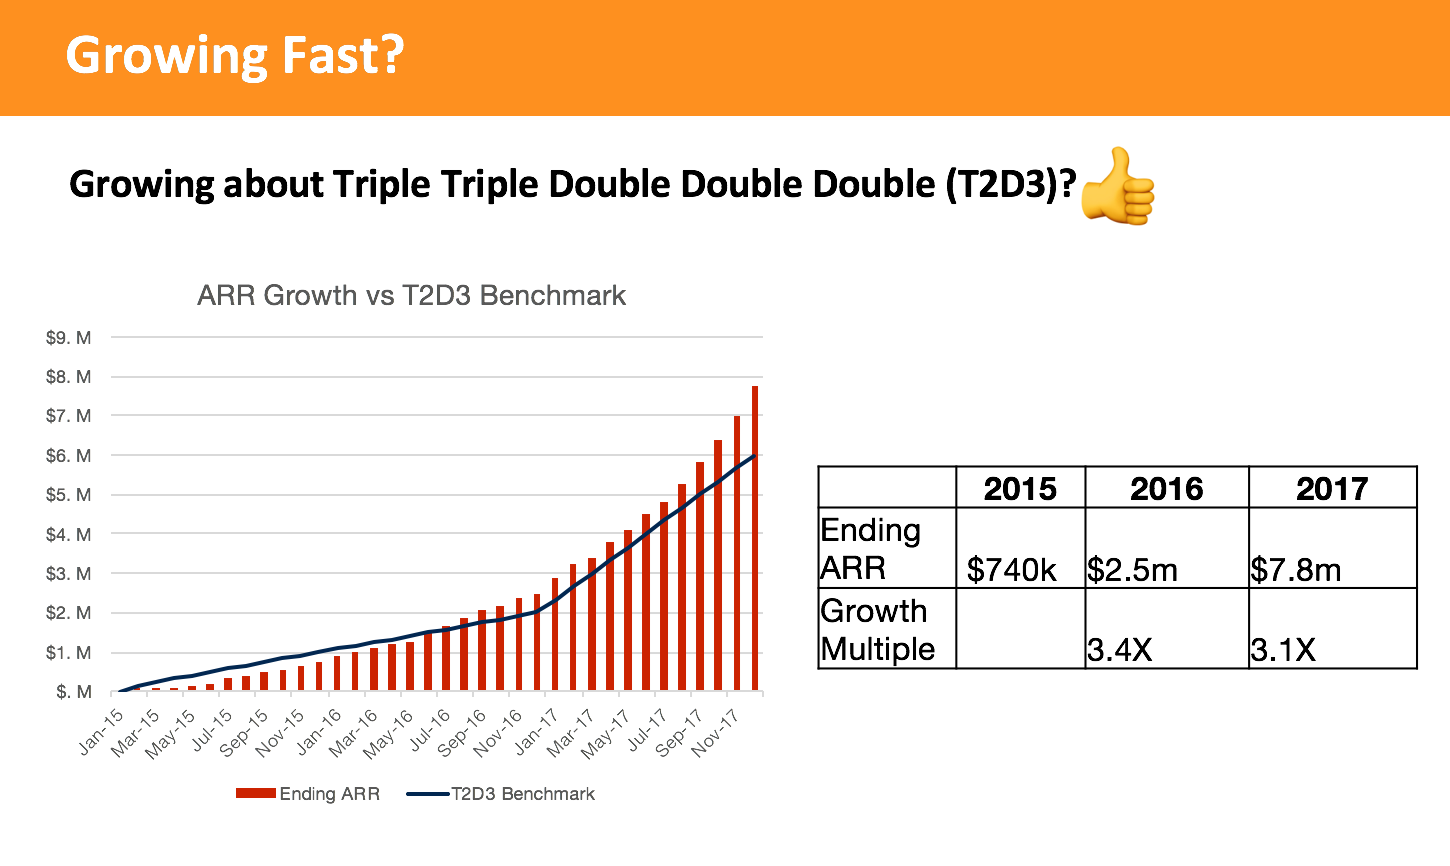
- Metric: Annual Recurring Revenue (ARR) and Capital Efficiency
- Why? A company demonstrating growth and scale in ARR is usually a sign of product/market fit: the product is delivering value to the customer. However, if a SaaS company is currently at $1m ARR while burning, say, >$1m/month in cash ($12m annualized burn), it may not be clear that company has product/market fit. Instead, the company may be spending aggressively to acquire customers who may end up churning from the product. Most investors will worry that without clear product/market fit, continued growth may not be sustainable.
- How to Calculate:
- Benchmark:
ARR:
Series A: $1–$3m ARR
Series B: $5m ARR
Source: Point9 SaaS Napkin
Cash Efficiency: There’s no specific rule but we consider businesses cash efficient if they didn’t burn much more than $xM to get to $xM of ARR. So if you’re at $3m ARR, in an ideal world you didn’t burn much more than $3m to date. Like everything, there are exceptions to this rule (e.g companies that have to spend a lot on R&D to create their tech moat) but realize investors will want to understand how capital was allocated.
- Example:
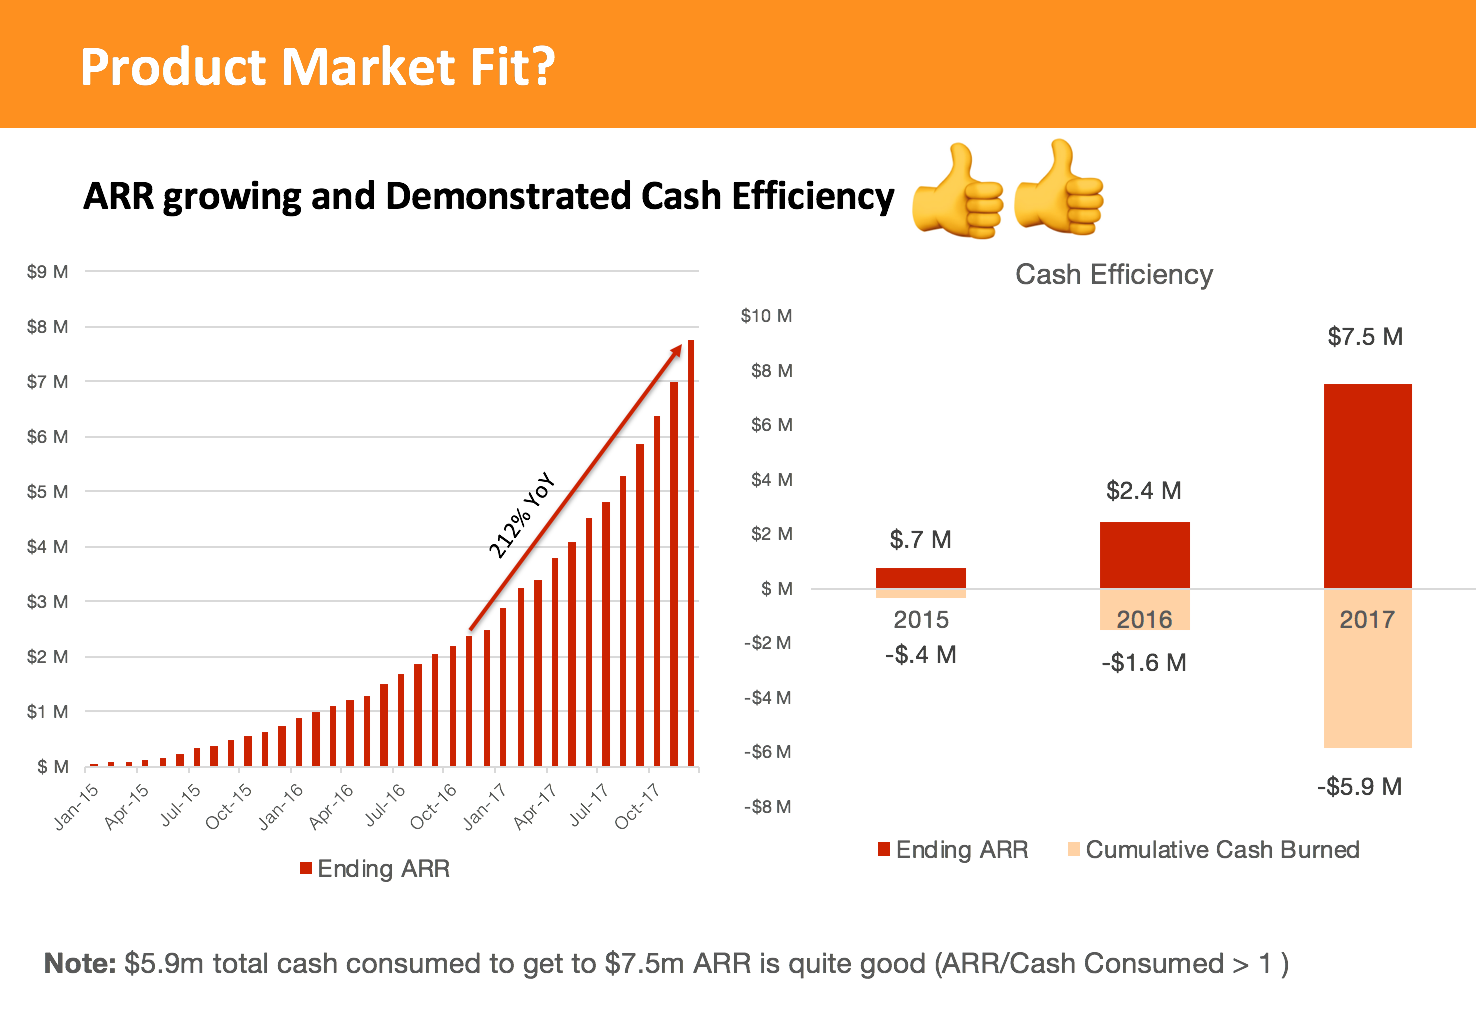
2. Is the Company Growing Fast?
- Metric:
1. ARR Growth benchmarked against Triple, Triple, Double, Double, Double (T2D3) or other successful SaaS companies
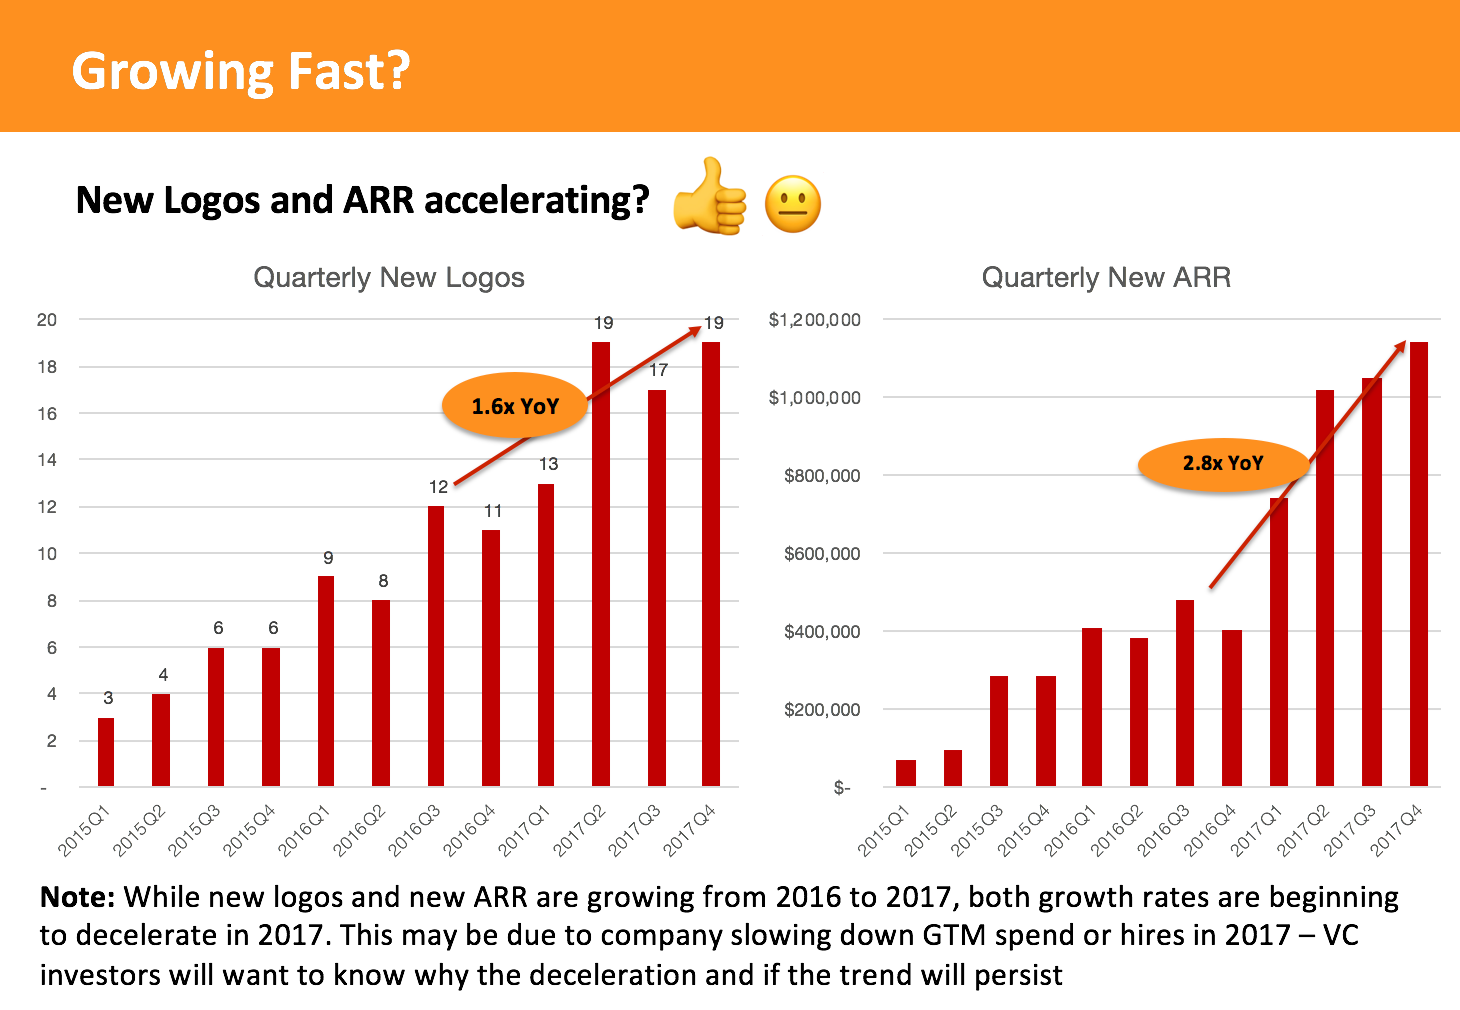
2. Quarterly New Logo and New ARR - Why?
1. Triple, Triple, Double, Double, Double (T2D3) is a saying for what it takes a SaaS company to grow from $1m to $100m+ in 5–7 years. Venture investors want to see how an investment into a SaaS company can generate a large multiple on their capital and there’s no better way than to grow fast and get closer to becoming a $100m+ ARR business. Granted, most companies don’t follow T2D3 to a tee but generally, at the Series A/B, growth investors will want to see at least a 2.5–3X YoY growth.
2. Investors generally like to see that new customer (logos) and ARR is accelerating quarter over quarter to show that the business has the potential to grow exponentially (versus linearly if logo and new ARR is about flat) - Benchmark: T2D3 Benchmark, Top Cloud Companies (Box, Shopify, Twilio, Sendgrid) from Bessemer
Series A: 3X+ YoY Growth
Series B: 2.5–3X+ YoY Growth
Source: Point9 SaaS Napkin - Example:
3. Is the Company Growing Efficiently?
- Metrics: Growth Accounting and Quick Ratio
- Why? Given that a company is growing fast, investors want to understand what is driving growth. Is growth coming from new customers or from upselling existing customers? Is there a leaky bucket problem where underlying the strong growth is customer churn or customers paying less?
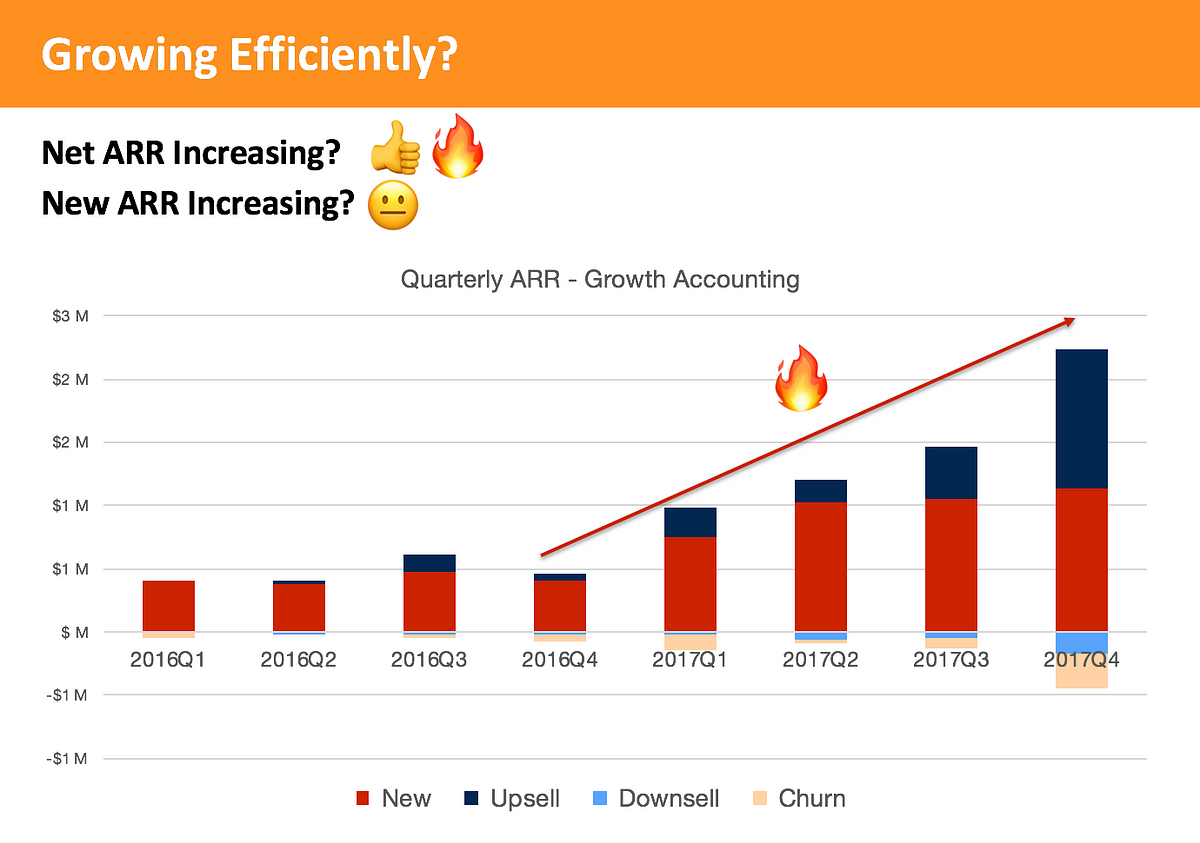
Growth Accounting is a way to break out ARR by month or quarter into new, upsell, downsell, and churn to understand the health of a business’s growth.
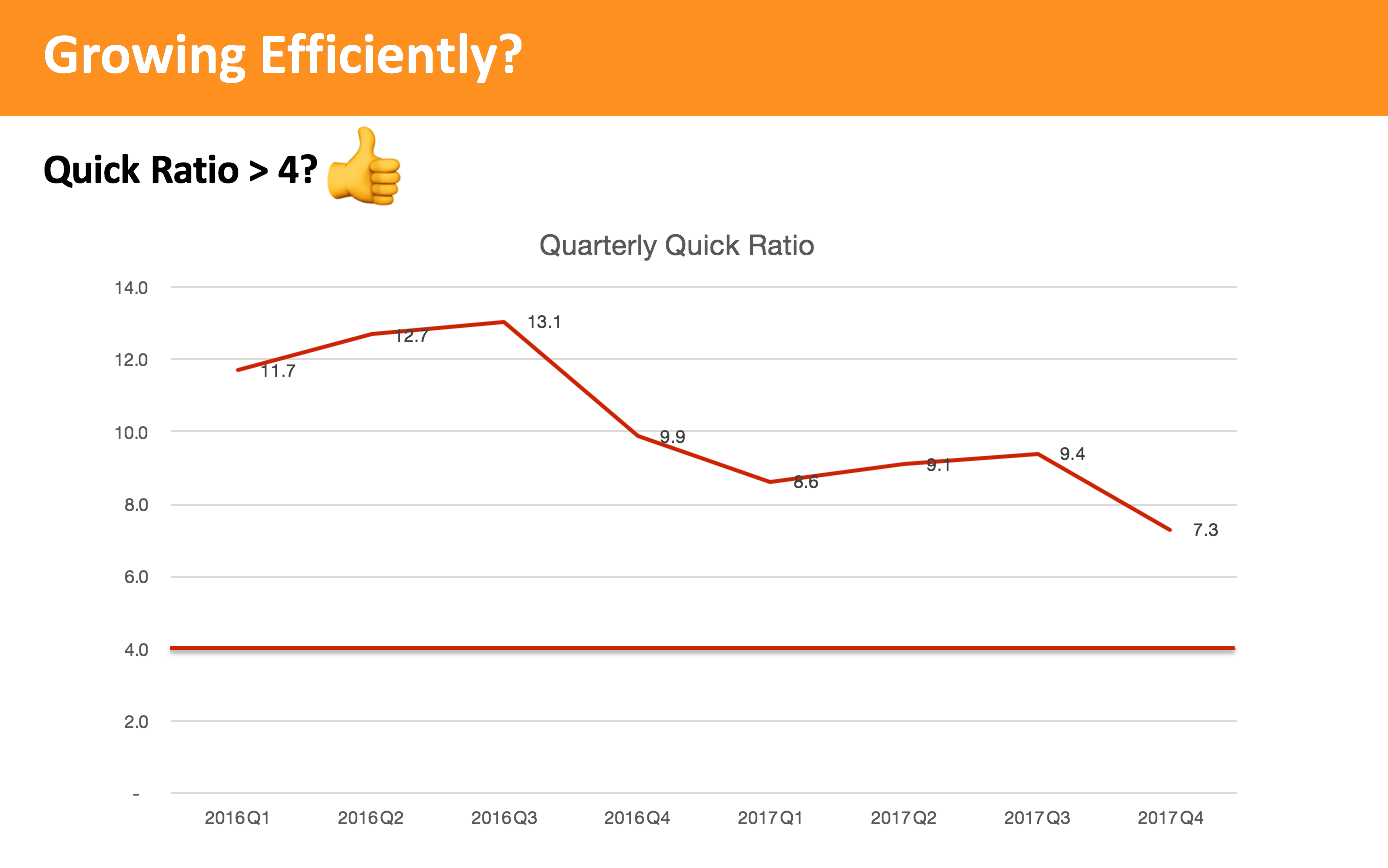
According to Mamoon Hamid, the quick ratio is “a quick heuristic to asses whether new business is growing way faster than the loss of existing business. A quick ratio is most relevant to business that has been around for at least a year, when a portion of the first year of customer's start churning.” We’ve personally found the quick ratio to help us quantify growth accounting into a single metric to understand and benchmark growth efficiency against other companies. - How to Calculate:
See our customer transaction file with calculations for how we do growth accounting for revenue and customers.
- Benchmark:
For ARR growth accounting, investors are generally looking for new and upsell to grow quarter-over-quarter or month-over-month while churn and downsell stay minimal (i.e Net ARR is increasing on an absolute basis quarter over quarter). A flat Net ARR quarter over quarter (QoQ) implies a company is growing linearly; a growing Net ARR QoQ implies a company is growing exponentially.
Mamoon Hamid, the creator of the quick ratio, preaches a quick ratio > 4 (For every $1 of downsell and churn, company is generating an additional >$4 of new and expansion)
4. Is the Company Retaining Customers?
- Metrics: Net Dollar and Gross Logo Retention via Cohort Analysis
- Why? Similar to the growth efficiency question, VCs are interested in what the underlying churn and retention look like for a business because companies with higher churn go through more capital to maintain the same growth rate and churn can significantly hamper growth. We’ve seen firsthand companies without a strong foundation (e.g customer success or retention program) raise money and pour fuel on the fire but end up going sideways because its earlier successes masked churn issues.
Note that churn and retention is also an indicator of product-market fit, as customers won’t stick around if your product fails to deliver enough value to the customer.
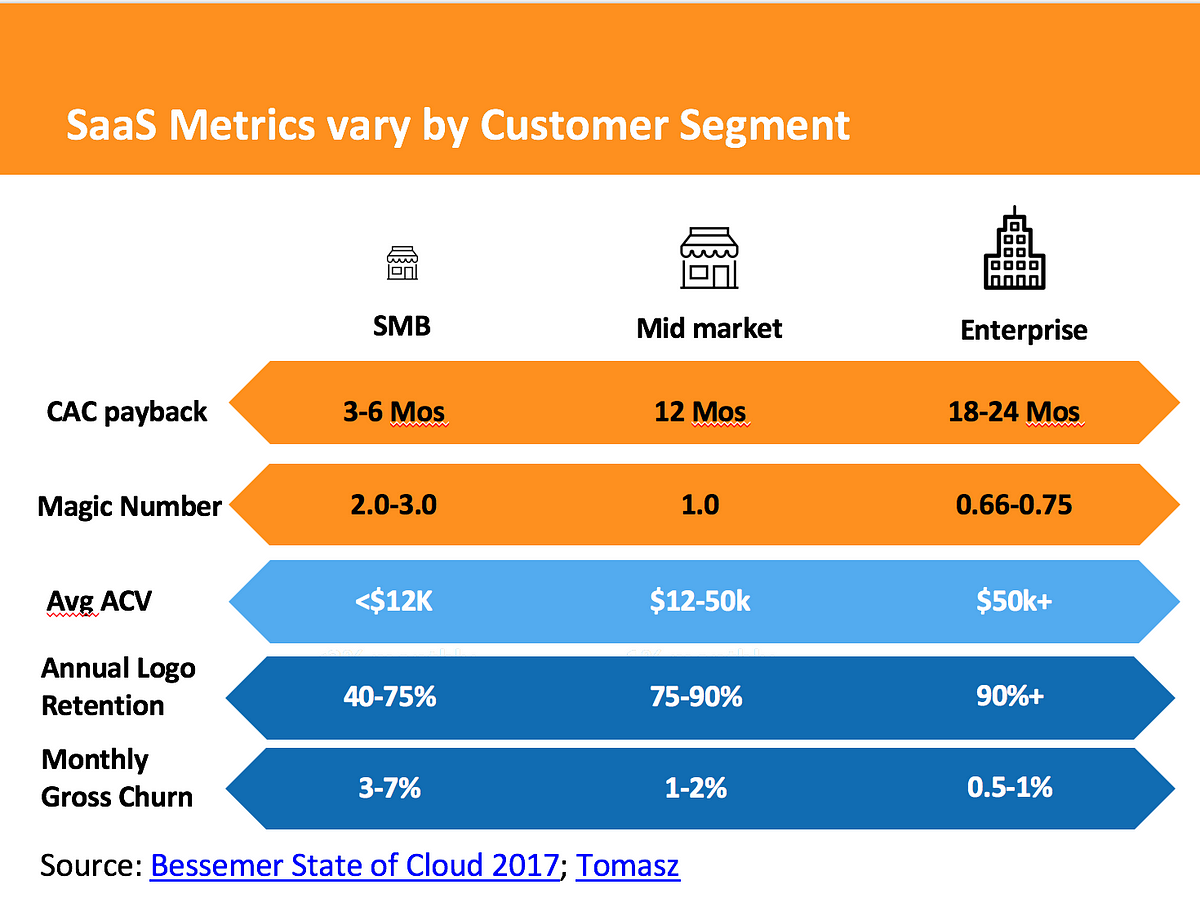
Keep in mind that churn and a company’s ability to be upsold is dependent on a company’s end market. Companies that sell into SMBs with low contract values and limited seats are naturally likely to experience more churn and less upsell than an enterprise software company selling $100k ACVs with opportunity to sell more seats to other business functions.
Note: Cohort analysis is difficult especially for companies with cohorts that are still < 12 months old or the number of customers renewing on an annual basis is very small in which case its hard to extrapolate retention numbers to future and more mature cohorts. - How to Calculate:
See our customer transaction file for how we calculate retention on a cohort basis and on a monthly blended basis. - Benchmarks:
We summarize the benchmarks in the charts below.
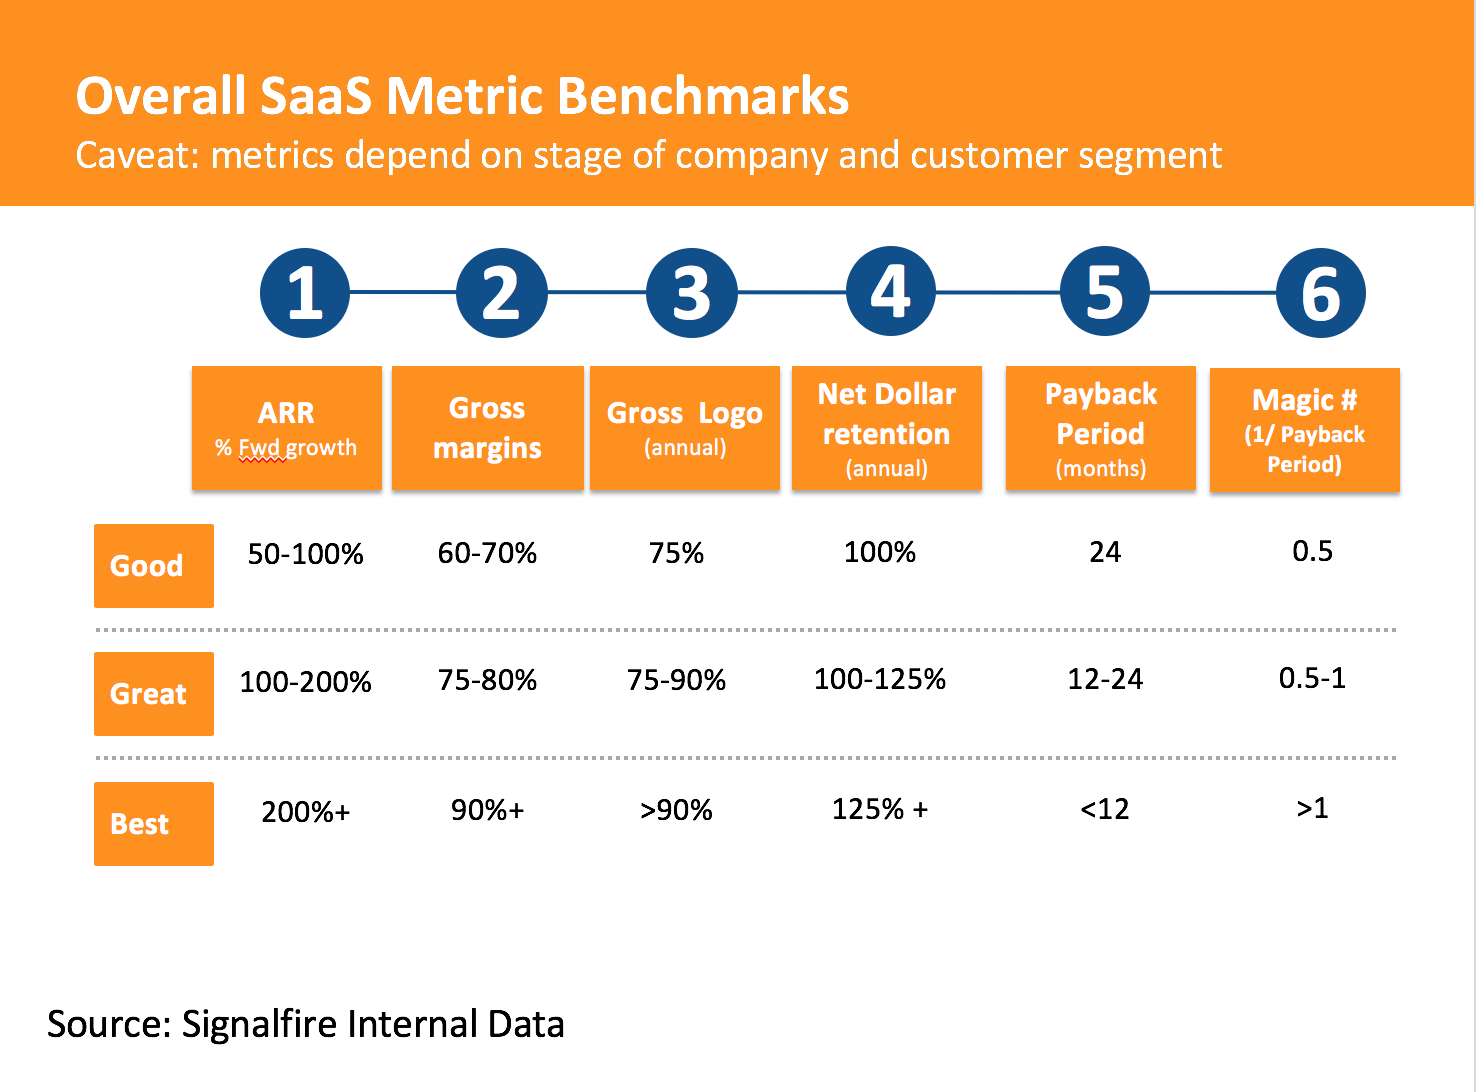
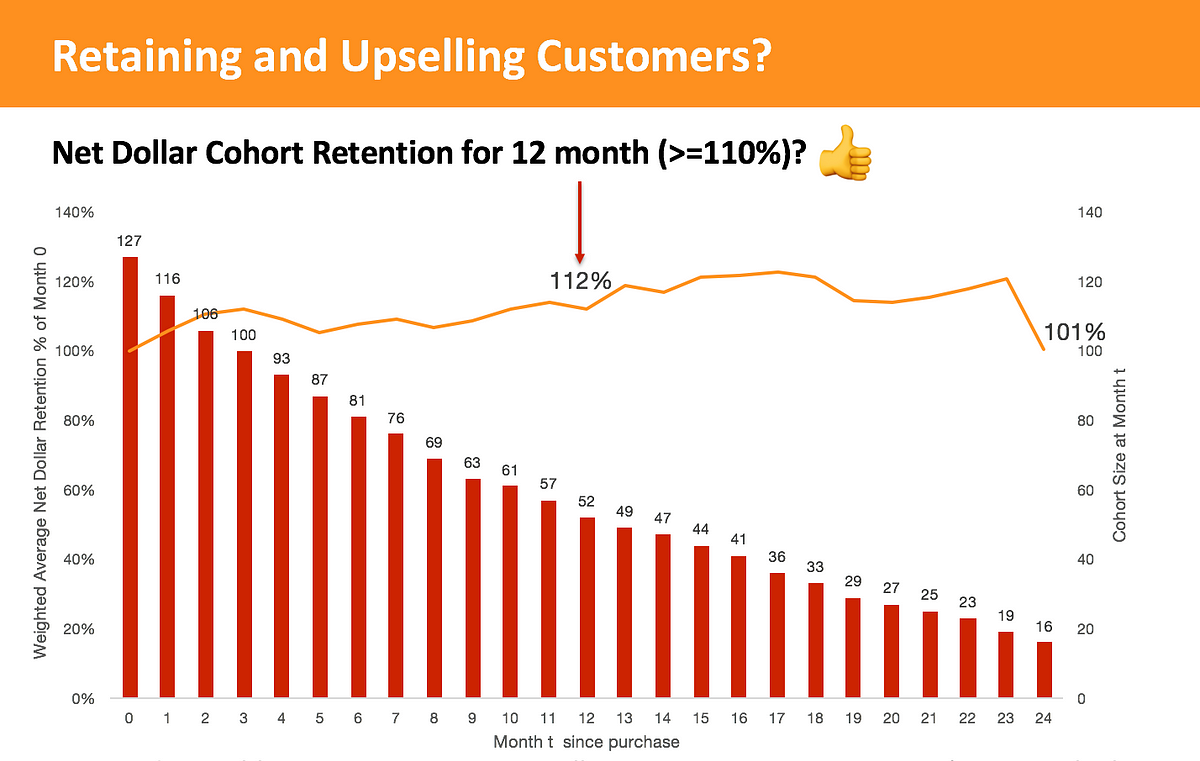
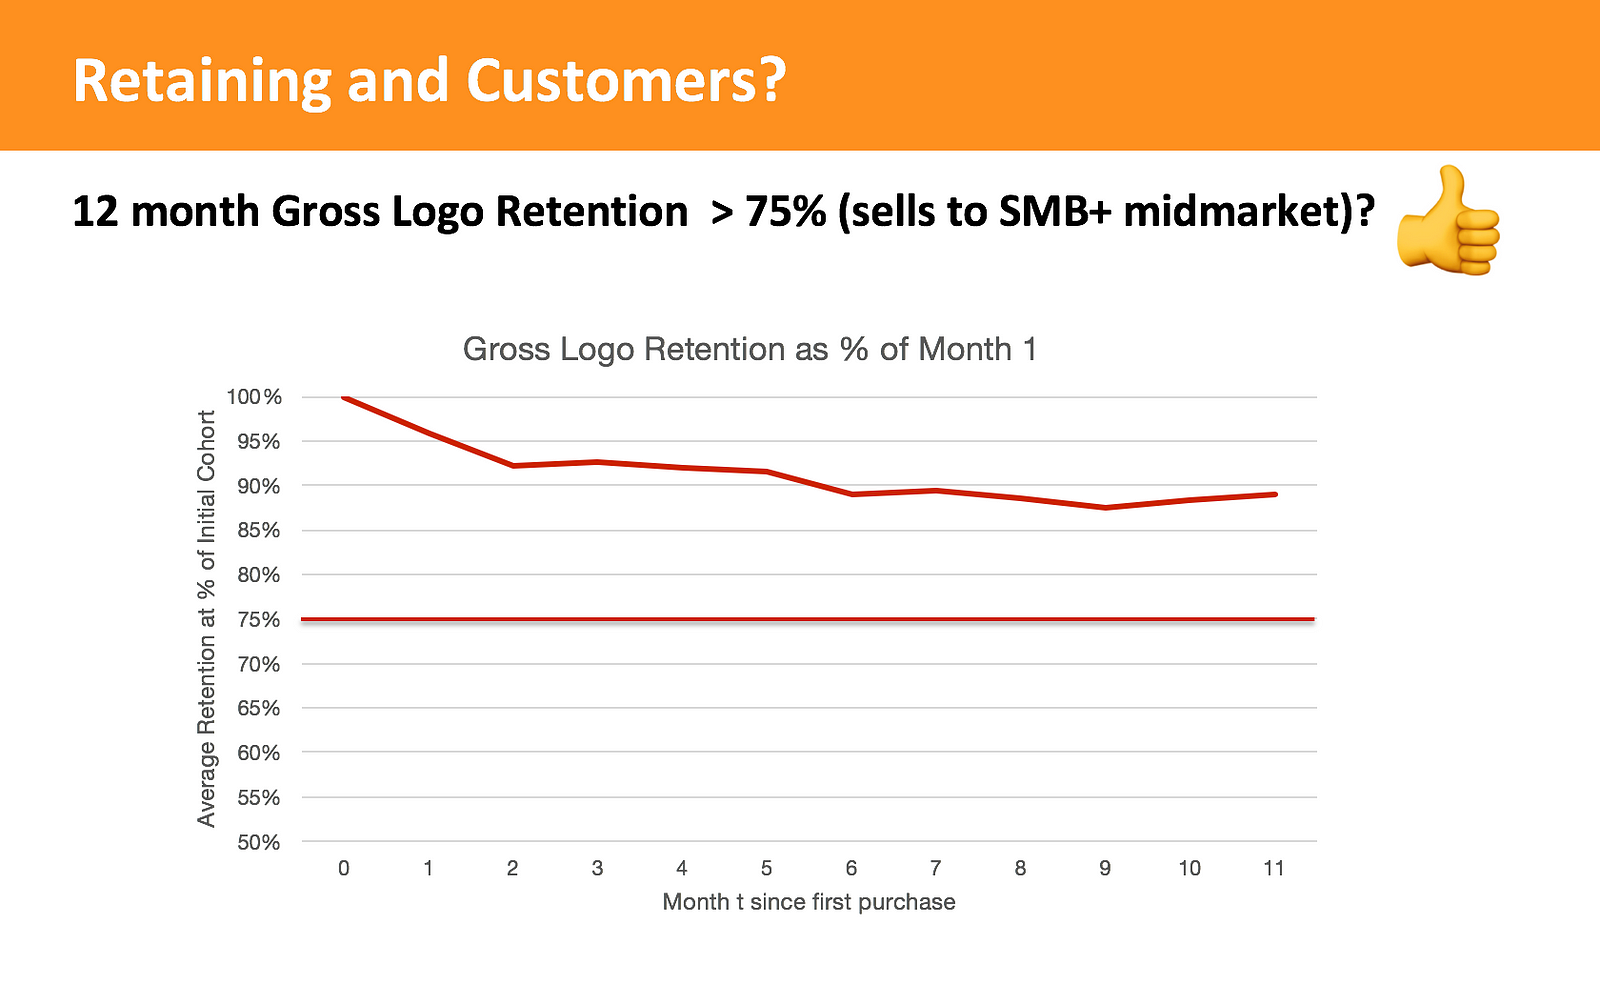
- Examples: Gross Logo retention is quite strong at 88% considering our imaginary SaaS company sells to midmarket and SMB — top-tier companies see logo retention rates of >85% according to Openview’s 2018 Expansion Benchmarks (see Logo Retention Rates on slide 44). Note that the 12 month (4 quarters) net dollar retention is about 112% which is great for a SaaS company (>105% is roughly top quartile net dollar retention according to the same Openview survey)
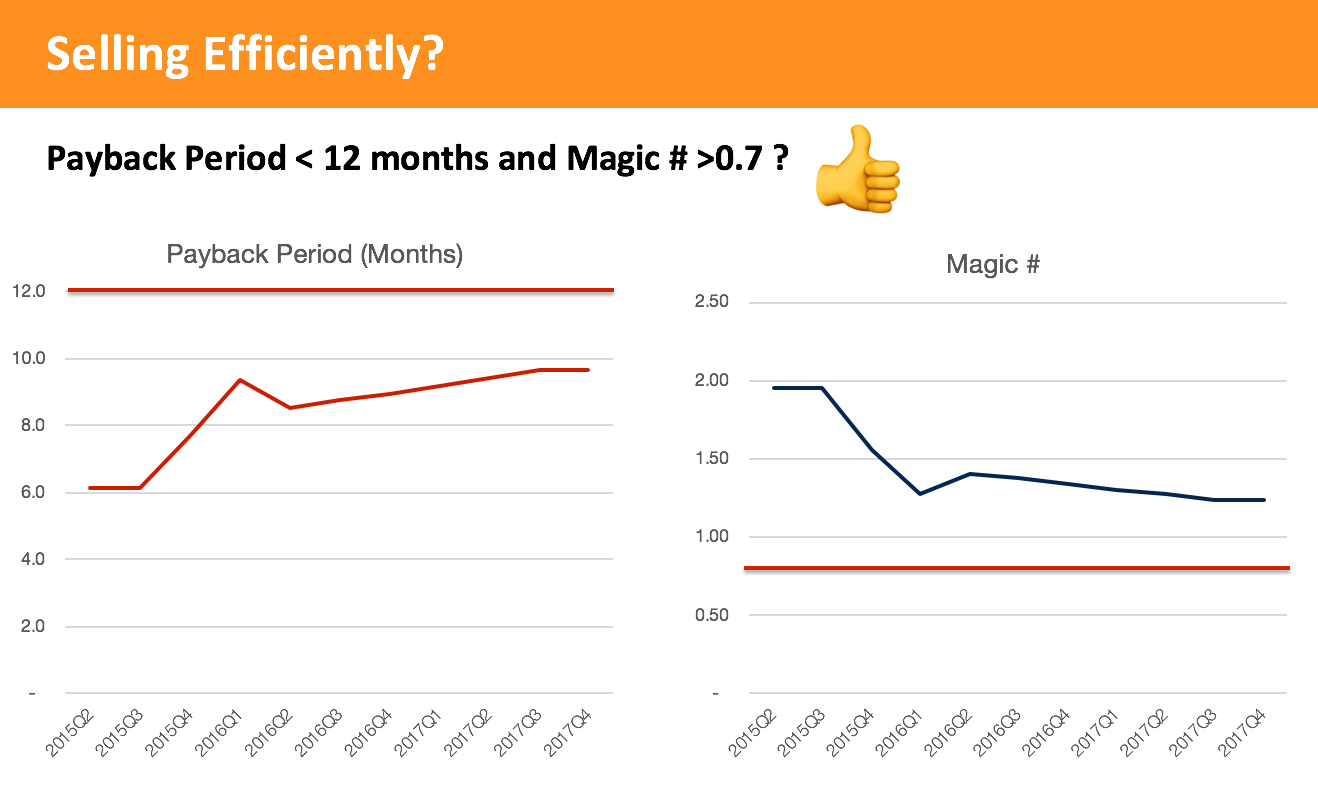
5. Is the Company selling the product efficiently?
- Metrics: Magic Number and CAC Payback Period
- Why? Venture Capital at its core is about identifying opportunities where companies can efficiently leverage capital to grow sustainable revenue and profits. As a result, VCs look for repeatable sales and one way to tease that out is looking to see if a company can consistently spend a reasonable amount to generate an additional dollar of incremental revenue.
A company with a Magic Number of 1.0 is spending $1 in sales and marketing to generate an incremental recurring revenue of $1 in the next quarter. With a Magic Number of <0.7, a company is effectively spending $1 in Sales and Marketing (S&M) to generate less than $0.7 in Net ARR. While it may sound crazy to spend a dollar to acquire a dollar in revenue, the key is that recurring revenue businesses with healthy retention makes that investment in S&M profitable (assuming software gross margins).
The inverse of Magic Number is CAC Payback Period which helps investors understand how long it takes for a company to recuperate the cost of acquiring a customer.
As Alex Clayton points out, enterprise software companies with high net dollar retention (i.e 140%) with high ACVs ($100k+) may require long payback periods (18 months +) which would be worth the tradeoff since the contracts grow for each account over time. - Side Note: Technically one should include Gross Margin % as part of their Magic Number of Payback Period calculations which we also include in our Transaction File Calculations. I emailed Rory at Scale, and his view is to not include gross margins in the Magic Number calculation because it can get quite noisy (e.g company could hire a lot on customer support ahead of a big growth curve which will decrease gross margin and thus magic number temporarily) and unlike other sales efficiency numbers, Magic Number can be compared apples to apples among public companies just using GAAP numbers.
- How to Calculate: Example included in our SaaS metrics tab
- Benchmark:
See our “SaaS Metrics by Customer Segment” table from the previous section. - Examples: Note that the Magic Number is just the inverse of CAC Payback Period! In other words, a Magic Number of 2.0 implies a 0.5 payback period in years (or 6 months). A Magic Number of 0.5 implies a payback period of 2 years (or 24 months).
Hopefully, the above examples illuminate the metrics that VCs look for in enduring SaaS companies, why they are important and how to calculate them for your next round of funding. We left off a few other important metrics (i.e gross margin, services vs software revenue, user engagement, customer concentration, sales attainment vs quota, company-specific North Star metric, etc) and benchmarks for consumer subscription companies which we will discuss in future posts, so stay tuned!
Special thanks to Jared Rosen, Chris Zeoli, Jim Hao, John Chen and Phil Orr for their comments and suggestions! Thank you to Mamoon Hamid, Rory O’Driscoll, Alex Clayton, and Nico Wittenborn for their feedback and answering our questions as well.
Appendix
- Jonathan Hsu’s Diligence at Social Capital walks through different frameworks around user and revenue growth accounting, different views of cohort LTVs, how to quantify user engagement depth and quality of revenue
- Christoph Janz at Point Nine points out the 6 key pieces of data Series A/B SaaS VCs will likely ask for and the key questions investors will ask.
- See Neeraj at Battery’s “SaaS Adventure” for more about “Triple, Triple, Double, Double, Double (T2D3)”
- Rory at Scale writes why the Magic Number is a great metric for measuring sales efficiency.
- Mamoon Hamid at KPCB and previously Social Capital discusses the quick ratio. Also in the same presentation, he talks about the importance of understanding what your company’s North Star metric is or the value your product delivers vs churn, upsell, and downsell MRR which are really lagging indicators of product/market fit.
- According to Alex Clayton’s SaaS IPO Benchmark, Median Net Dollar Retention for public SaaS companies is 117% and 92% for gross dollar retention (gross dollar excludes upsell)
- Tomasz at Redpoint includes a lot of other great benchmarks including benchmarking exceptional Series A SaaS companies
- Sean Fanning and Kyle Poyar @ Openview have very comprehensive SaaS benchmarks for 2018. Includes metrics by stage (A,B,C) and revenue scale.
- Dave Kellogg at Host Analytics includes a great One-Slide Financial Dashboard that VCs generally will want a view into