How to forecast SaaS revenue better than the analysts
Using an 85% growth persistence estimate for revenue produces more accurate results than the analyst estimates.

Summary
- Actual revenue numbers are on average 2.7% higher than consensus analyst estimates for SaaS companies.
- For high-growth SaaS, actual revenue numbers are on average 7% higher than analyst estimates.
- Using an 85% growth persistence estimate for revenue produces more accurate results than the analyst estimates.
What are analyst estimates and why are they important?
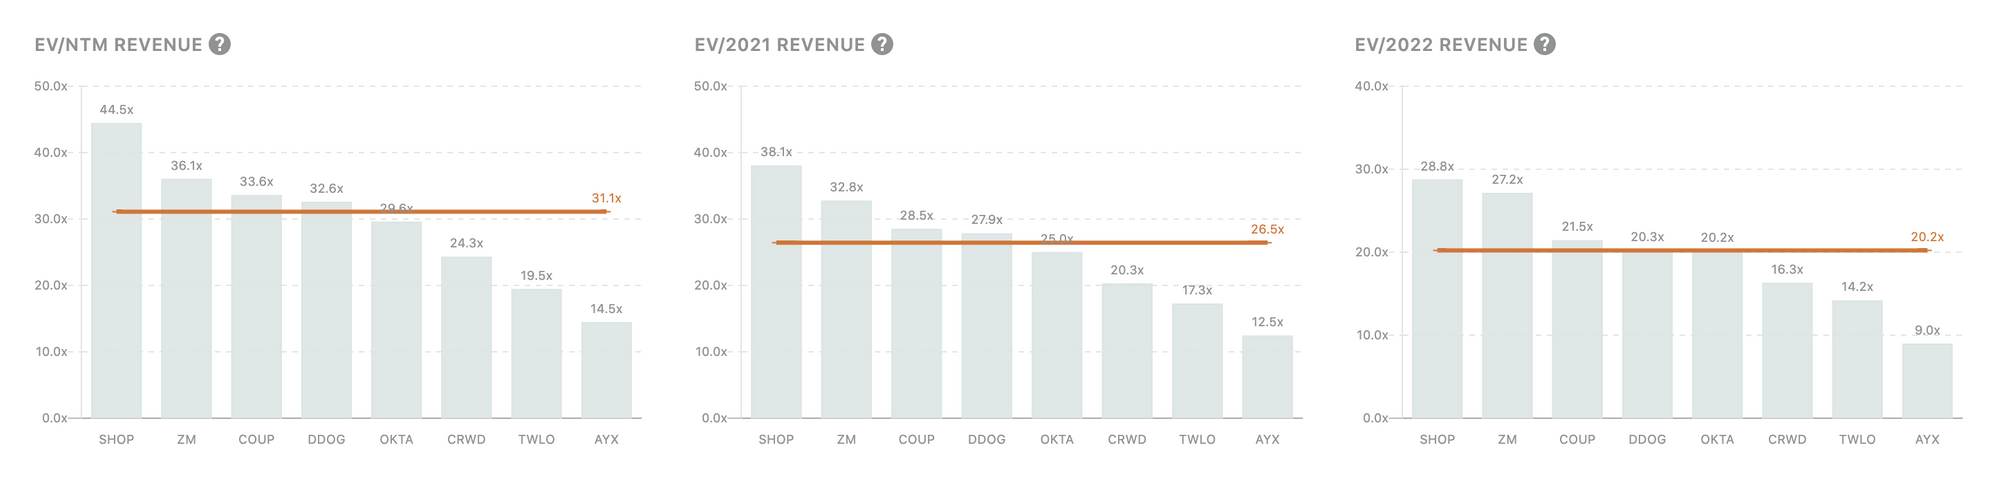
In the world of B2B SaaS, investors often use forward revenue estimates to value a company. These forward estimates (often referred to as consensus estimates) are released by sell-side research analyst who try to follow and model these companies. Investors look at these number relative to the company's enterprise value (EV) to see how "cheap" or "expensive" a company is relative to it's future revenue, whether it's the next-twelve-months or several years in the future.

It's an open-secret that these estimates are often lower than actual revenue numbers. These researchers are incentivized to be conservative because overestimating revenue looks worse than underestimating revenue. Even when companies beat their analyst estimated earnings, the stock can plunge because the buy-side (hedge funds) predicted an even higher revenue. This begs the question, how much lower are estimates compared the actuals?
Revenue Beat Analysis
I analyzed 282 earnings for 100 B2B SaaS companies using data from Public Comps between 2016 & 2020. The primary metric I used is "Revenue Beat" which I defined as Actual Revenue / Mean Analyst Estimated Revenue. I used the latest mean estimate for each quarter, which should be the most accurate.

On average, actual revenue is 2.7% higher than analyst estimates (median 2.4%). This error margin adds up when you are using estimates for multiple quarters across longer time horizons.
What if we run analysis for high-growth earnings? High-growth earnings are earnings for companies that were growing >= 40% in the previous quarter.

Earnings for high-growth companies beat analyst estimates by 7% on average (median 5.7%). This is a huge discrepancy on a quarterly basis, and across a year can sum up to > 20% difference. The conservative nature of these estimates downplay the quality and consistency of growth, and will make growth companies look more expansive relative to future revenue when using them.
Knowing these estimates are consistently off for growth companies, you might ask are there better ways to estimate forward revenue than these expensive analyst estimates?
Using Growth Persistence Estimates
While working in VC, I heard of a concept called growth persistence from Scale Venture Partner's blog:
As a rule of thumb, therefore, next year's growth rate is likely to be 85% of what this year's was
For example, if you have a company that grew 50% this year, we can expect it to grow 42.5% the next year.
I often used this concept to estimate forward revenue when I didn't have access to analyst estimates. To generate a growth persistence estimate, I took the growth rate of the corresponding quarter from the previous year , multiplied it by 0.85, and solved for the implied revenue. With the Public Comps data, I can analyze the effectiveness of the growth persistence estimate.
The median growth persistence (revenue growth / last year revenue growth) in our data is consistent with this rule (85.4%). I then experimented with how accurate the growth persistence estimates were compared to the actual revenue.


Using the growth persistence estimates beat analyst estimates both on all SaaS and high-growth SaaS. The mean beat was reduced to 1.7% and 4.5% respectively, while the median actual revenue beats were both < 1%. It's incredible how much more accurate using this simple rule is over consensus estimates. This rule requires only two data points (previous revenue growth & previous revenue) that you get almost a year before the earnings, while sell-side analyst have months of research up until the earnings release.
Conclusion
While using analyst estimates is a common practice, it is known that these estimates are conservative, and especially so for high-growth companies. Even simple calculations like the growth persistence estimates have outperformed them. While they are useful data-points for understanding an investment, the buyers & sellers of these assets are often predicting revenue earnings at higher values, and incorporating other key SaaS metrics in their decisions.
When looking at the expensive EV/forward revenue multiples for growth companies, remember it's a little cheaper than meets the eye.
If you have any questions, feedback, or concerns, feel free to shoot me an email!
Howard Chen, Public Comps Team
howard@publiccomps.com
Like this analysis? Subscribe to the newsletter here where we send out investment memos, market maps and analysis on the broader SaaS market.
Disclaimer: The author owns stock directly in AYX, CRWD, TEAM, TWLO, AMZN, FB, DDOG, ESTC, and ZM. Public Comps (SaaSy Metrics LLC) provides financial and industry information and analysis regarding public software companies as part of our weekly dashboard, our blog, and emails. Such information is for general informational purposes only and should not be construed as investment advice or other professional advice.