Public Comps Weekly Dashboard 8/21/2020: Market recovery, API earnings, and investigating Payback Period
We break down API's first public quarter

👋 Public Comps Customers 👋
In this newsletter, I benchmark SaaS against public indices, take a quick look at median B2B SaaS valuations, teardown API's first public quarter, and dive into the importance of the Payback Period metric.
1️⃣ SaaS Stock Prices vs. Benchmarks 📊
On an interesting note, the S&P 500 returned to an all-time high on Tuesday – the first time in 180 days the major index returned to pre-COVID highs since the start of the bear market on February 19th 😮!
Today marked the 1st day the S&P 500 returned to pre-COVID highs🚀
— Albert Wang (@albertwang23) August 18, 2020
180 days later, here are the top 10 B2B SaaS📊$FSLY: +224%$ZM: +166%$DOCU: +129%$NET: +122%$BAND: +102%$TWLO: +97%$ZS: +96%$SHOP: +89%$WIX: +85%$DDOG: +76%
Avg B2B SaaS: +20%📈
Source: @publiccomps pic.twitter.com/WWQW3AsHZ9
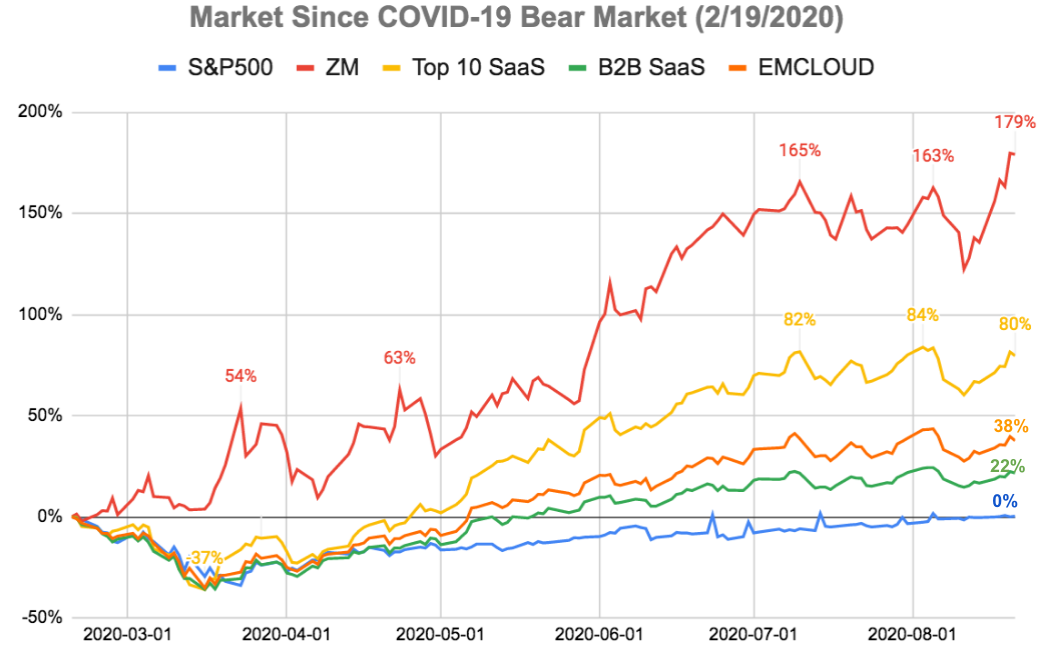
Change since bear market start (2/19/2020):
- S&P 500: +0.33%
- B2B SaaS: +21.6%
- Top 10 SaaS: +79.5%
- Bessemer Cloud Index (EMCLOUD): +37.6%
- ZM: +179%
Change in the past week:
- S&P 500: +1%
- B2B SaaS: +4.9%
- Top 10 SaaS: +13.6%
- Bessemer Cloud Index (EMCLOUD): +6.3%
- ZM: +18.3%
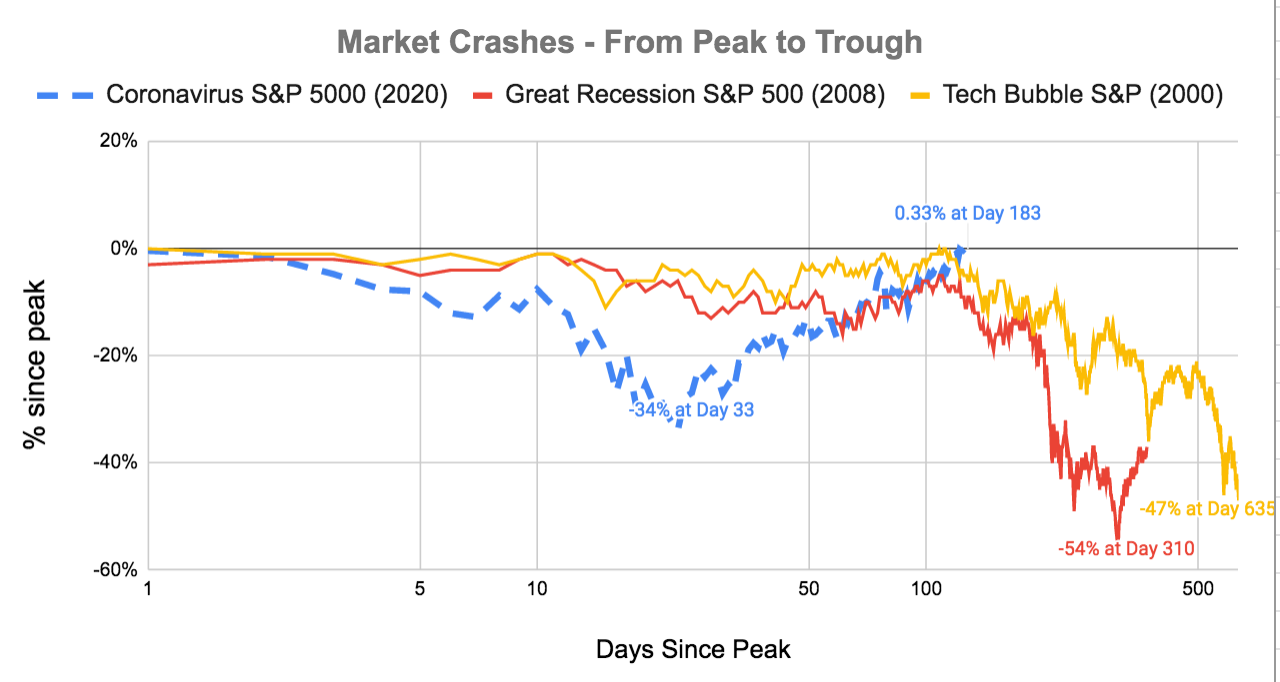
2020's S&P 500 during COVID-19 marked the fastest recovery from a bear market in history, the 126 trading days (180 calendar days) it took to reclaim its February 19th peak was significantly faster than index’s average historical rebound (1,542 trading days).
The market this week was highly volatile; early in the week, growth tech stocks reasserted their dominance over value shares, and large-caps handily outperforming small-caps. Technology stocks were also strong, boosted by gains in Nvidia, Google, and Apple – which became the first U.S. publicly traded company with a market capitalization over $2 trillion. In the broader market, the energy sector recorded declines as OPEC and other major hydrocarbon-producing nations announced predictions of a slow recovery in global oil demand. Financials, another prominent value sector, underperformed after Warren Buffett’s Berkshire Hathaway revealed a significant reduction in its bank holdings.
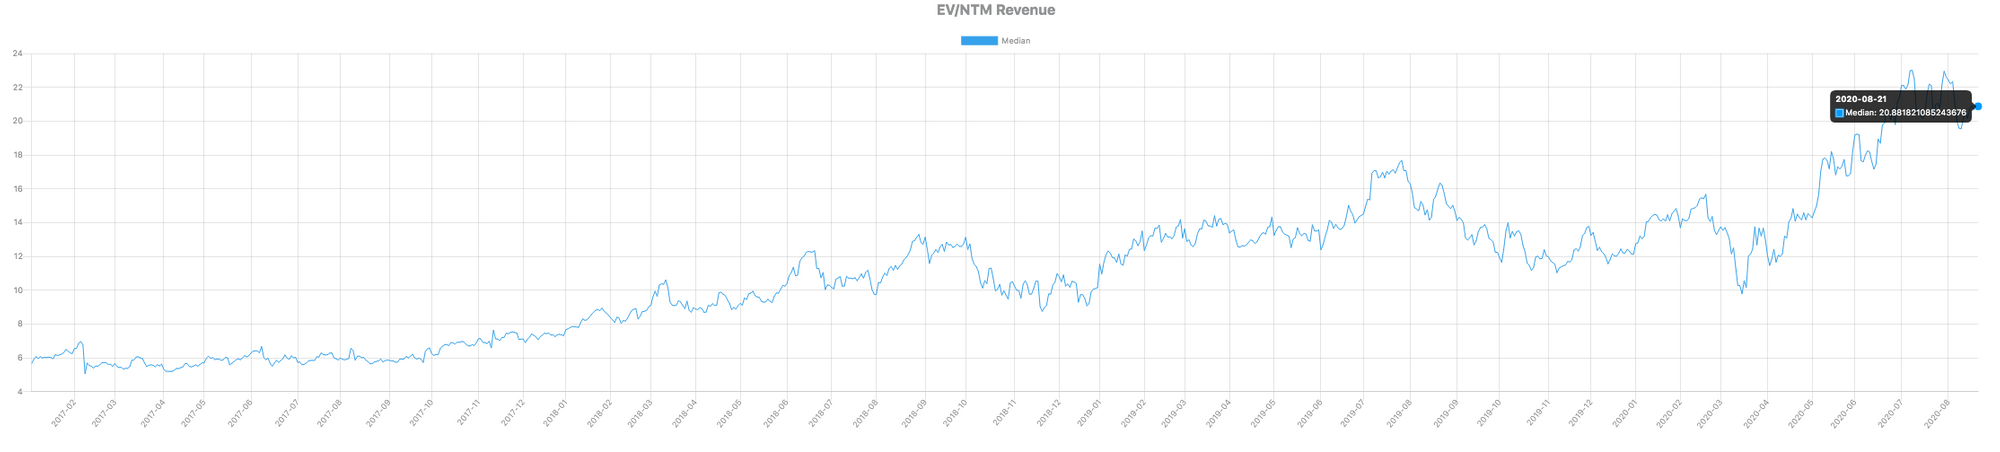
2️⃣Median B2B SaaS Valuation Multiples: 11.3x🔥
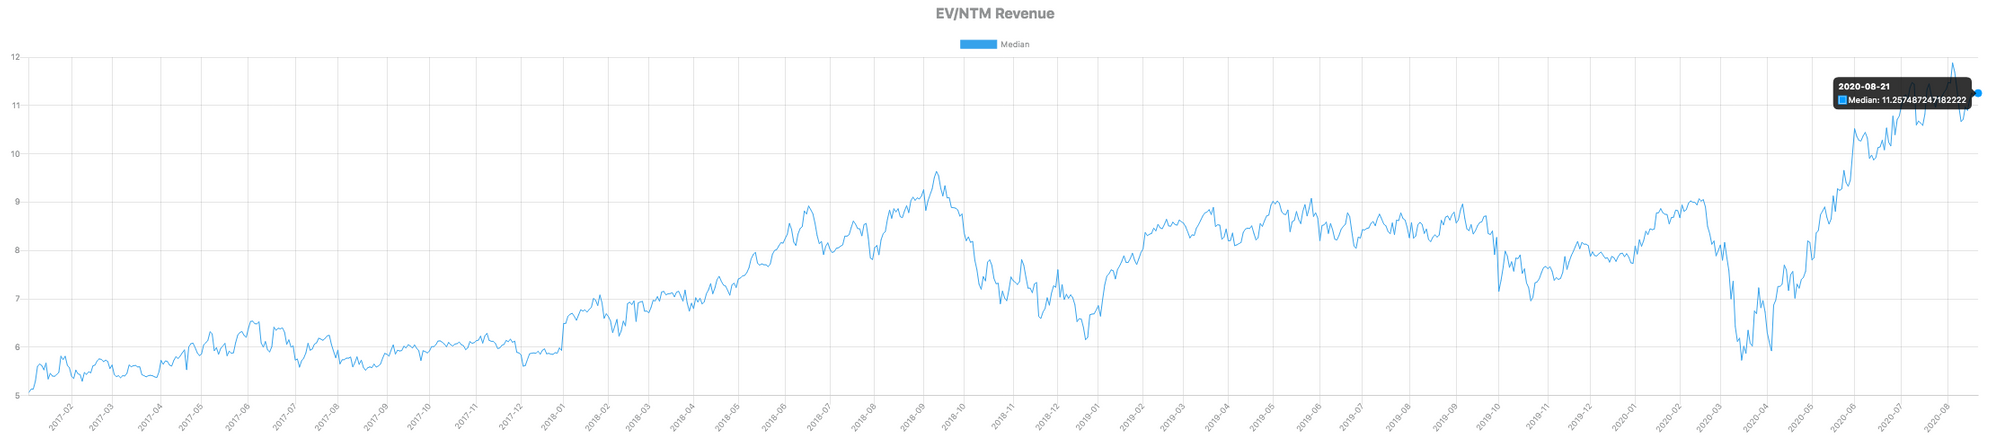
Median B2B SaaS multiple is currently 11.3x and for high growth, its currently 20.9x.
In the spreadsheet tab of our dashboard, we show all company metrics, and users can toggle which relevant SaaS metrics they'd like displayed. Here I show Revenue growth, EV/NTM revenue multiples, and NTM Revenue growth (sell-side implied revenue growth).
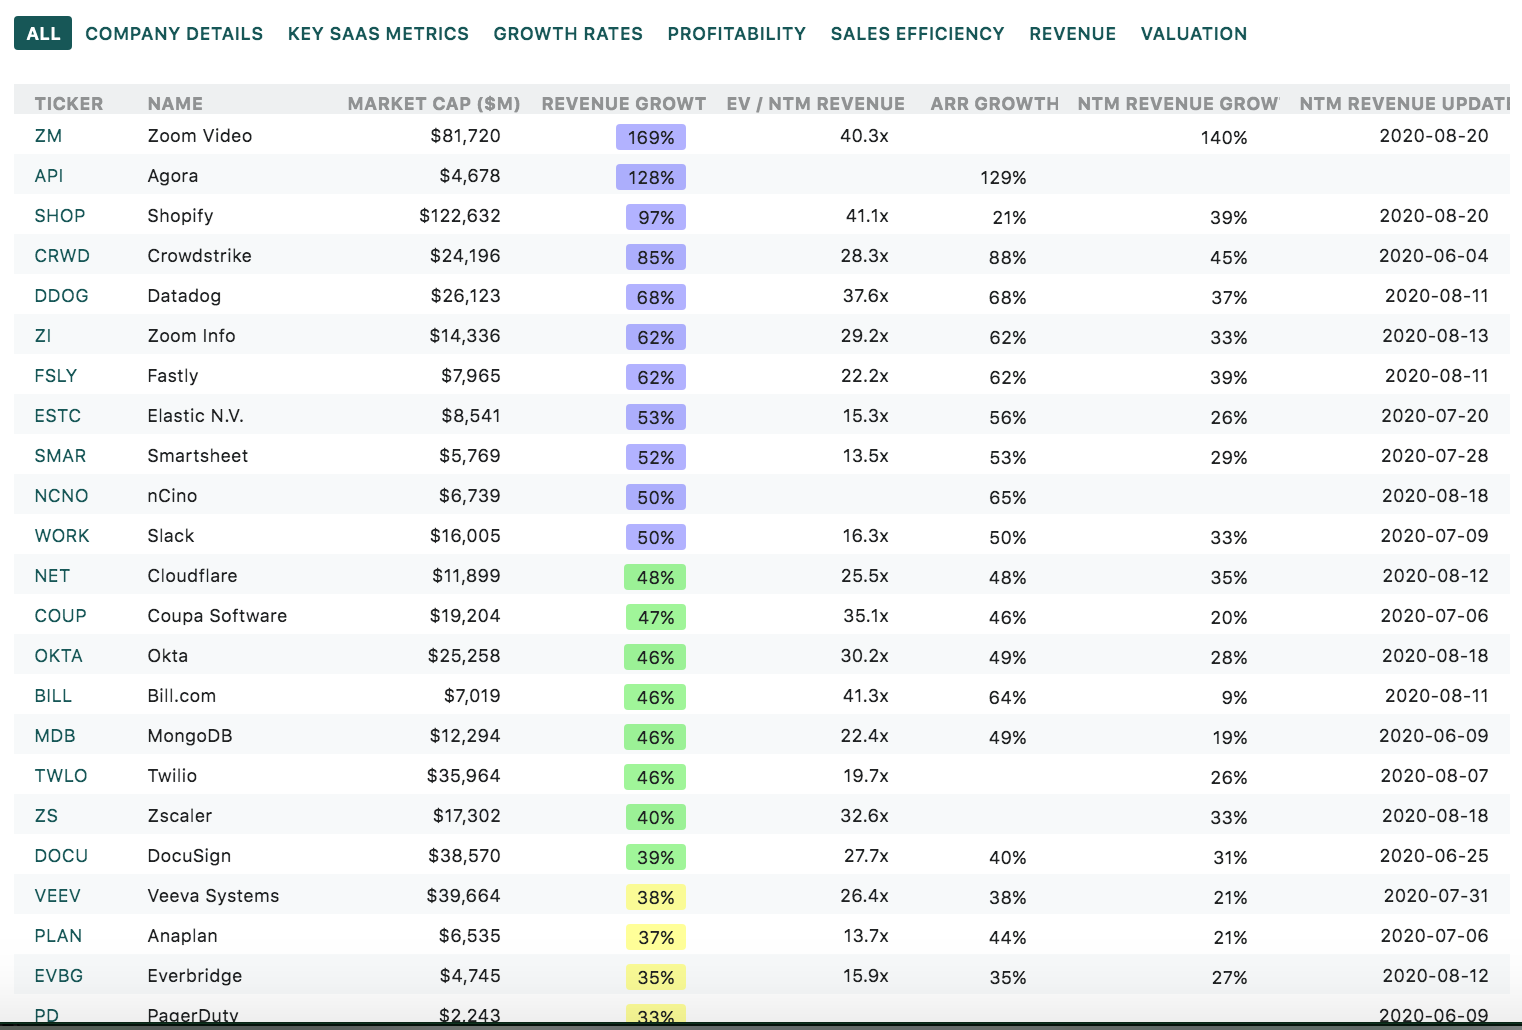
While some "High Growth SaaS" fwd revenue multiples look extremely stretched, its important to understand that these multiples are on the basis of sell-side consensus NTM revenues, which are dramatically underestimated. Specifically, The dichotomy between sell-side and buy-side is most dramatically seen in BILL (Bill.com), which grew ARR by 63.6% in the past quarter, and has consistently grown revenues in the high 40s - 50s range.
Yet, sell-side has only projected 9% revenue growth over the next twelve months. Clearly, sell-side was extremely conservative with this estimate, and in working with company management, they have no incentive to be accurate because they want these companies to beat, which they almost definitely will. In the context of understanding forward multiples, its important to recognize that they're calculated on the basis of sell-side estimates, but markets move on buy-side consensus, not sell-side.
For great analysis on historical averages of B2B SaaS revenue & earnings beats, and how using growth persistence of 85% is a more accurate measure, check out this article by our co-founder, Howard Chen.
3️⃣SaaS Earnings - Agora (API)💸
My friend Richard Chu wrote an awesome in-depth article on Agora earlier this week – here I'll just be recapping a few of my own high-level thoughts and breaking down their earnings results.
Overview: Agora is a video communications platform that enables the development of video software through its APIs. The platform allows developers to embed real-time video, voice, messaging and recording functionalities into their apps without having to build the infrastructure themselves.
Strategy: Agora is extremely developer-focused with a bottom-up sales strategy and strong developer community.
Market: Agora operates in an exceptionally large TAM that has accelerated growth as COVID-19 helped remove many barriers to adoption. The market for video was previously estimated to grow at 43.6% CAGR to $3.5B by 2023.
Why Agora wins:
- Product - Agora has a dedicated network which uses sophisticated algorithms to plan traffic and optimize routing which helps ensure reliability (similar to how Twilio has its Super Network) – this feature is unavailable on the public internet, and helps provide superior UX. Agora's architecture is purpose-built for video.
- Specialized use case - As a result, Agora can handle audiences of over a million along with 17 hosts in a live video stream and maintain quality across its global user base in over 100 countries. Agora is considered the best product for broadcasting (one-to-many use case).
- Price - friendly pricing (10k free minutes of real-time engagement per month per account and then charges usage-based beyond that) helps boost adoption.
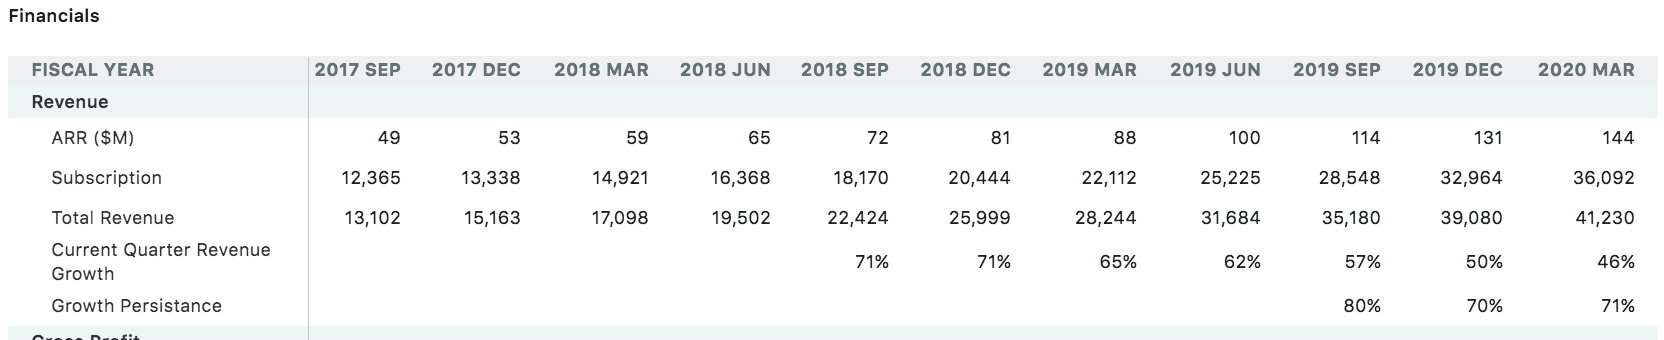
Earnings Highlights:
Agora's $API 1st public quarter:
— Public Comps (@publiccomps) August 17, 2020
🎥Leading platform for video APIs
🔥Revenue: 33.9M +128% yoy
👉Gross margin: 66.4% down from 69.2%
🙌Customers: 1486 +85% yoy
🚀Net dollar retention: 183%
👏Free Cash Flow: $3.3M (10.6% margin)
💵Cash: $641M
⬇️Shares are down -11% AH
Earnings thoughts:
- A big trend will be improvement of webRTC which will drive adoption of Video APIs. The bottleneck on video providers as a service is they’re all in browser (because that’s the only way they can get a large base of customers to scale) and WebRTC on browser is limited right now -- that’s why Zoom is much better, because it’s a desktop app.
- Agora can be a higher margin business than other CPaaS offerings. Similar to Zoom outsourcing R&D to China for its cheaper labor costs, Agora operates entirely in China, and thus has extremely sustainable attrative long-term FCF margin potential. Further, Video is a cheaper communications service to offer than SMS which many other CPaaS platforms provide because SMS requires paying telecom fees which can be expensive and incredibly competitive internationally.
- Agora is the 2nd fastest growing B2B SaaS at 128% yoy growth, only behind Zoom at 169%.
- Agora's net dollar retention (183%) is best-in-class and can likely sustain this growth given that customers and use cases are still very early.
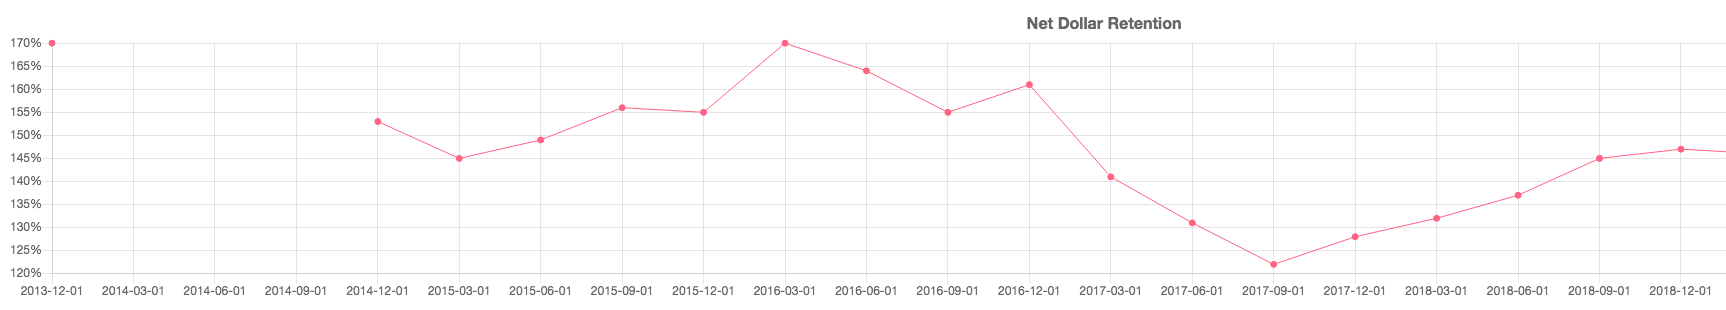
For context on how good this is, take a look at Agora compared to other B2B SaaS net dollar retentions:
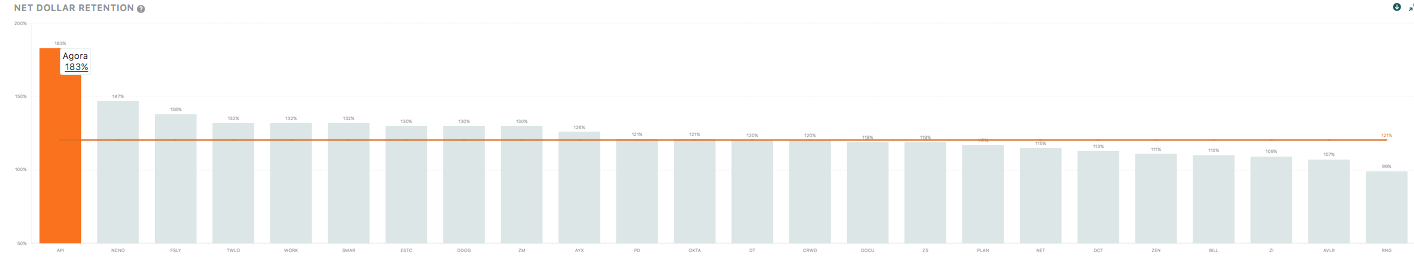
The closest comparison to this is when Twilio went public back in 2016 at 170% net dollar retention, and had two public quarters of 161% and then 155% net dollar retention.
Perhaps most interesting in their earnings was the 85% customer growth (yoy). Since use cases of Video are just now becoming commoditized and Agora's business model is on usage-based pricing, Agora is well-positioned to capture this growth.
5. Video is being commoditized:
Here's a great quote from Benedict Evans on the commoditization of Video:
"I think this is where we’ll go with video - there will continue to be hard engineering, but video itself will be a commodity and the question will be how you wrap it. There will be video in everything, just as there is voice in everything, and there will be a great deal of proliferation into industry verticals on one hand and into unbundling pieces of the tech stack on the other. On one hand video in healthcare, education or insurance is about the workflow, the data model and the route to market, and lots more interesting companies will be created, and on the other hand Slack is deploying video on top of Amazon’s building blocks, and lots of interesting companies will be created here as well. There’s lots of bundling and unbundling coming, as always. Everything will be ‘video’ and then it will disappear inside." - Benedict Evans ("Zoom and the next Video")
Coupled with this great paragraph on their own vision from Agora's F-1:
“Students in an education application want to see their classmates and work on a group assignment together; players in a poker application want to see each other’s faces to pick up on visual tells; users in a dating application want to see their potential partners as they get to know one another; and buyers in a shopping application want to talk to sellers. The potential opportunities for such contextual real-time video or voice engagement are only limited by one’s imagination.”
Video is being built into everything – from workplace applications like Tandem to dating apps offering video chat.
4️⃣ Why does Payback Period matter?⏰
Last week we pushed an update to our scatter plot feature, this week we tweeted this: showcasing the strong correlation between high multiple valuations and payback period.
Payback period is one of the most important SaaS metrics and has one of highest correlation to forward revenue multiples📈
— Public Comps (@publiccomps) August 19, 2020
Payback period is a measure of sales efficiency that measures the time (in months) to recover the cost of acquiring a cohort of customers in gross profit🔁 pic.twitter.com/KNLFA80vtB
Payback period is a measure of sales efficiency that measures the time it takes to recoup the investment (in gross profit) of acquiring a customer. Embedded in the metric is a company's gross margin and selling & marketing expenditure as a percent of revenue. A lower payback period is better because this means that companies' sales teams are efficient in being able to growing revenues without having to spend to much. Payback period is calculated as 1/CAC ratio, where CAC ratio looks at the increase in gross profit from the previous quarter times 4 (4 quarters in a year) divided by the S&M expense.
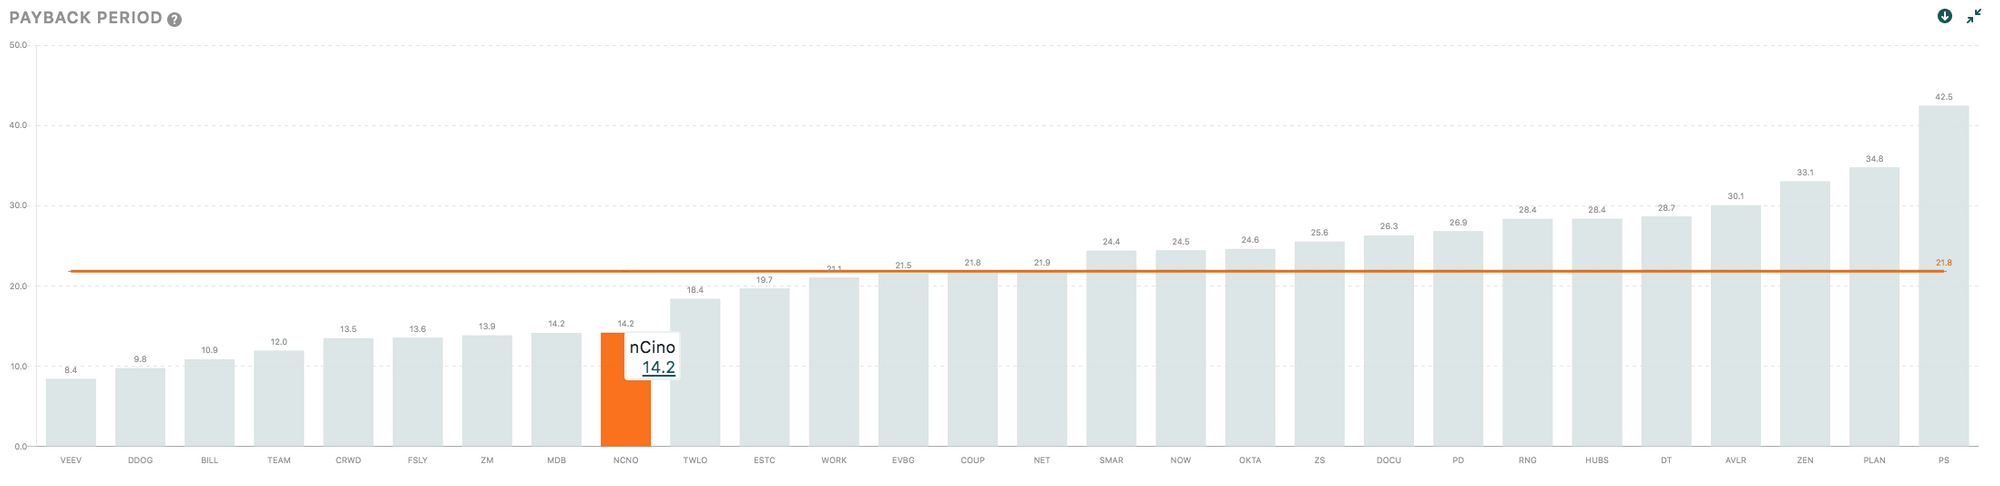
Generally, a payback period of <18 months is considered very good, although companies that primarily sell to enterprise (which have longer sales cycles but generally higher ACVs). Here, we have our high growth SaaS category, with a median payback period of 21.8 months, and Veeva Systems (VEEV) is best-in-class with a payback period of just 8.4 months! Understanding payback period can help give context to acceleration/deceleration in revenues, and can be a leading indicator of future revenue growth.
Its no surprise that some of the hottest stocks of 2020 have some of the lowest payback period. The best-in-class companies are benefitting disproportionately from having better unit economics. Markets used to be more fragmented than they are today and thus, category leaders are grabbing a greater proportion of market share than they used to. Being the "de-facto market leader" in a particular sector helps reduce sales friction and "consumerization of SaaS" trends in companies like Zoom and Slack have helped with sales efficiency.
As always, feel free to shoot me an email if you have any questions, feedback, or concerns.
Stay safe everyone,
Albert Wang, Public Comps Team
albert@publiccomps.com
Like these weekly dashboards? These are for Publiccomps.com customers only but you can have your friends subscribe to the newsletter here where we send out investment memos, market maps and analysis on the broader SaaS market.
Views expressed in theses emails are ours and ours alone and don't represent that of our previous or current employers. Public Comps provides financial and industry information regarding public software companies as part of our weekly dashboard, our blog, and emails. Such information is for general informational purposes only and should not be construed as investment advice or other professional advice.
Full disclosure: I own CRWD, TWLO, SHOP, LVGO, FB, MSFT, DDOG, ESTC, AYX, API, ANGI, SMAR, PLAN, and ZM.